Markets remained flattish (0.3%), but volatility ensued post declaration of bankruptcy by three major US
banks and one non-. IT and Auto have been the laggards while Metals and O&G have been the frontrunner
sectors. The INR appreciated against USD in March after it had depreciated in the previous month. It
averaged around 82.3 with a monthly best and worst of 81.9 and 82.7 respectively. 10yr benchmark yields
traded in the range of 7.29%-7.43% and eventually ended the month 12bps lower sequentially at 7.31%.
The 10y benchmark averaged 7.36% in March.
March witnessed the second biggest bank run in US history since Washington Mutual in 2008 as customers of Silicon Valley Bank withdrew deposits worth USD 42bn within 48 hours of bank announcing that it needed to raise USD 2.3bn. Concerns related to safety of deposits led to bank runs in 2 other banks – Signature Bank and Silvergate Bank. As a response, Federal Deposit Insurance Corporation (FDIC) stepped in to protect the deposits of SVB and Signature bank while the US Fed announced availability of additional funding for eligible institutions to ensure deposit needs of customers are met. This increased the fears related to strength of the banking system and a possibility of financial contagion. At 6% YoY, US recorded its lowest inflation since Sep’21 but services-ex shelter, a leading indicator of US inflation as it represents services wage growth, remained elevated at 6.9% YoY. Demand continues to hold in the US as moderation in addition of non-farm jobs was below consensus but Fed would take solace in the fact that unemployment rate has inched upwards while average hourly earnings growth was below consensus. On expected lines, Fed undertook a 25bps and has projected a PCE inflation of 3.3% with terminal fed fund rate projected at 5-5.25% in 2023. Europe’s banking system fragility too came under limelight as Credit Suisse, one of the largest banks in the world collapsed and is being acquired by its Swiss rival – UBS bank. EU witnessed its inflation moderate for the 3rd month in a row to 8.5% but UK surprisingly witnessed a rise in inflation to 10.4% YoY as it was contributed by discretionary items like restaurants, café and clothing while food & energy bills too remain high in the country. ECB on expected lines undertook a 50bps rate hike in March’23 while bank of England undertook a rate hike of 25bps. Cutting down on interest rates seem to have taken a back seat for now.
High frequency indicators suggests domestic consumption continues to remain resilient as represented by GST collections, E-way bill generation and strong consumer payments data. Manufacturing sector strengthened in the last month of the fiscal year as PMI manufacturing was recorded at a 3 month high on account of factory orders rising due to resilient demand and competitive pricing. CPI fell marginally to 6.4% YoY in March vs 6.5% in February as cereal and milk prices continue to keep food prices high. Core inflation continued to remain sticky at 6.1%, which is higher than MPC’s inflation targeting upper tolerance limit of 6%. While RBI hiked the repo rate by 25bps in Feb’23, there are widespread expectations that RBI would undertake another 25bps rate hike in Apr’23. Government continued to rein in the fiscal deficit by moderating its capex. By end of February, government had already achieved 79% of its budgeted capex driven by railways and roads as both sectors have achieved 107% & 103% respectively of their initial budgeted capex. With 90% of tax revenues achieved, government’s fiscal deficit has been just 88% of the initial budgeted fiscal deficit. Falling imports led to fall in trade deficit coupled with strong service exports led to current account deficit narrowing down to 2.2% of the GDP in Q3FY23 vs 3.7% in the previous quarter. Government has come up with its borrowing plan for the first half of FY24 – of its Rs 15.4tn gross market borrowing target, its plans to borrow Rs 8.9tn (57.6%) in H1FY23. The borrowing would be spread over 26 weeks with amount ranging from Rs 310bn to Rs 390bn per auction while bond maturity would range from 3 to 40 years. Similarly, of its Rs 17.7trn marketable T-bill borrowing plan, government would undertake borrowings worth Rs 4.2tn (24%) in Q1FY24.
Brent crude prices decreased from an average of USD 83.5/bbl in February to USD79.2/bbl in February as it traded between USD 73-USD82/bbl. Increased systemic risk arising out of collapse of 3 US banks led to oil prices falling by ~USD10 in the first 15 days but reduced uncertainties related to USA’s financial system and disruption in Iraqi Kurdistan oil supply led to oil prices increasing to USD 79.8 by end of the month. Gold saw huge gains as it ended at USD 1,979/oz in March from USD 1,825/oz in February on account of concerns related to US banking system. Optimism related to Chinese economic recovery drove steel prices upwards as HRC prices ended the month at USD 1,154 compared to USD 1,054 in February.


 Source: Bloomberg
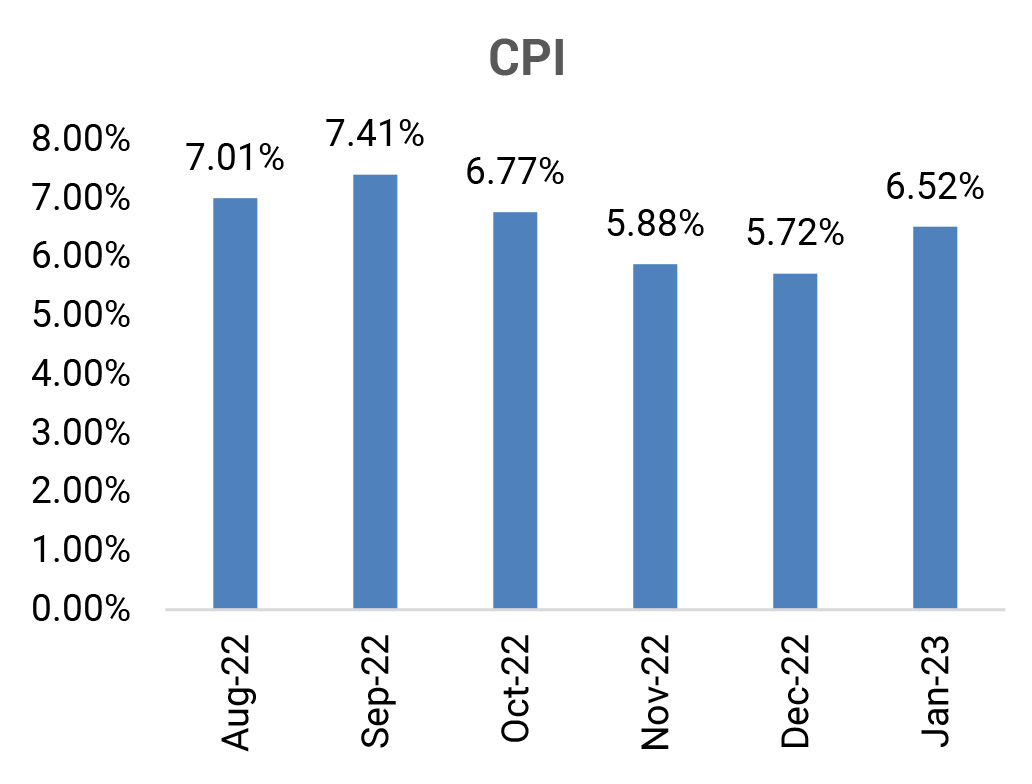
CPI: February CPI inflation moderated to 6.44% (January: 6.52%, Kotak: 6.35%), led mainly by a sequential
fall in food prices. Sequentially, headline inflation increased 0.2% (January: +0.5% mom). The moderation
was mainly due to a sharp sequential fall in prices of eggs ((-)5.7% mom versus +2.3% in January) and
vegetables ((-)2.5% mom versus (-)3.8% in January), even as fruit prices rose sharply 3.3% mom (January:
+0.2% mom). February core inflation (CPI, excluding food and fuel) moderated 10 bps to 6.1% (January:
6.2%), while also moderating sequentially to 0.41% (January: +0.52% mom). Personal care and effects
category rose the most by 9.4% (though moderating from 9.6% in January), followed by clothing and
footwear inflation at 8.8% (9.1% in January).
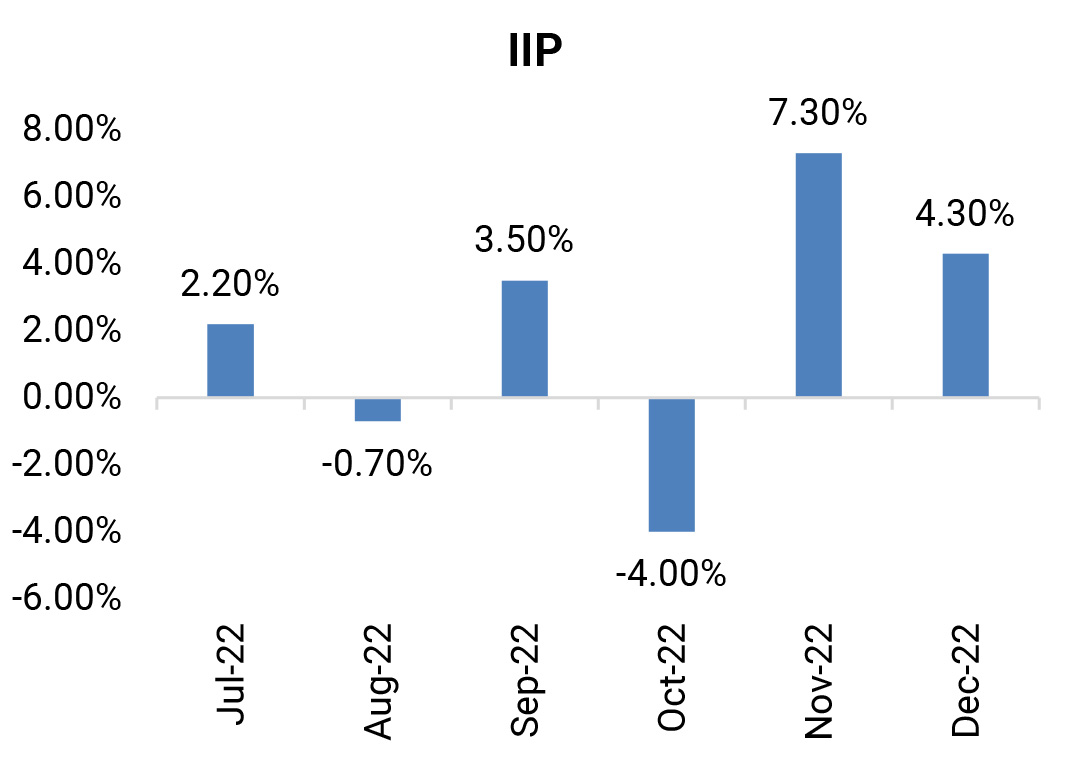
IIP: January IIP registered growth of 5.2% yoy (December: 4.6%) amid a sharp fall in adverse base effects. Sequentially, IIP increased 0.8%. On a sectoral basis, all components exhibited positive growth, with electricity production growing 12.7% (December: 10.4%) and mining activity growing 8.8% (10%). Manufacturing, however, grew at a muted 3.7% (December: 3.1%). According to the use-based classification, all segments registered positive growth, except for the consumer durables segment. Growth was led by capital goods growth at 11% (December: 7.8%), primary goods growth at 9.6% (8.4%) and construction goods at 8.1% (9.1%). On the other hand, consumer durables growth was at (-)7.5% (December: (-)11%).
Government Borrowing: The government plans to borrow 58% of FY2024BE gross borrowings of Rs 14.31tn in H1FY23. The government will borrow Rs 8.88tn through dated borrowings in H1FY23, 7.1% higher than H1FY23 borrowings. Accordingly, the net issuance in H1FY24 would be heavier compared, with H1FY23 at around Rs 7.3tn (H1FY23: Rs 5.9tn). The weekly dated securities’ auctions size will be in tranches of Rs310-390 bn (Rs 320-330bn in H1FY23), distributed across 26 weeks. Supply in the 5-year segment has seen the sharpest fall (11.7% of total H1FY24 supply compared with 14.1% of total H1FY23 supply), with only a marginally lower supply in the 7-year segment. Supply in the 10-year segment is broadly unchanged. However, the indicated issuances in the 14- to 40-year buckets is higher at 51.2% of total H1FY24 supply compared with 46% of total FY2023 supply.
CAD: Q3FY23 CAD eased to USD 18.2bn (2.2% of GDP from 3.7% of GDP in Q2FY23), led by improvements in goods trade deficit and net service exports. Goods trade deficit narrowed to USD 72.7bn (Q2FY23: USD 78.3bn), amid a sharper fall in imports compared to exports due to fading of pent-up demand and lower crude oil prices. Services exports continued to trend higher, led by software services and professional and management consulting. Capital account surplus in Q3FY23 rose sharply to USD 30.2bn (Q2FY23: USD 1.4bn), led by banking capital inflows (USD 14bn compared with (-) USD 8bn in Q2FY23). Foreign investment moderated to USD 7bn (from USD 13bn in Q2FY23), led by lower FDI and FPI net inflows. Overall, lower current account deficit and higher capital account surplus led to the BOP registering a surplus of USD 11.1bn (Q2FY23: (-)USD 30.4bn).
Trade: Trade deficit in February was steady at USD 17.4bn (January: USD 17.7bn) and at USD 250.6bn in 11MFY23 versus USD 172.5bn in 11MFY22. February exports at USD 33.9bn (January: USD 32.9bn) fell 8.8% yoy. Non-oil exports increased to USD 29bn (January: USD 28bn), whereas oil exports remained steady at USD 4.9bn. February imports were broadly unchanged at USD 51.3bn (January: USD 50.7bn), led by marginally higher oil imports at USD 15.1bn versus USD 14.7bn in January and flat non-oil imports at USD 36.2bn. Furthermore, non-oil trade deficit continued to narrow for the fifth consecutive month.

Deal flow picked in February with 23 deals worth USD 645mn executed. Key deals included Samvardhan
Motherson International Limited (USD 194.84mn) and RHI Magnesita (USD 109mn).
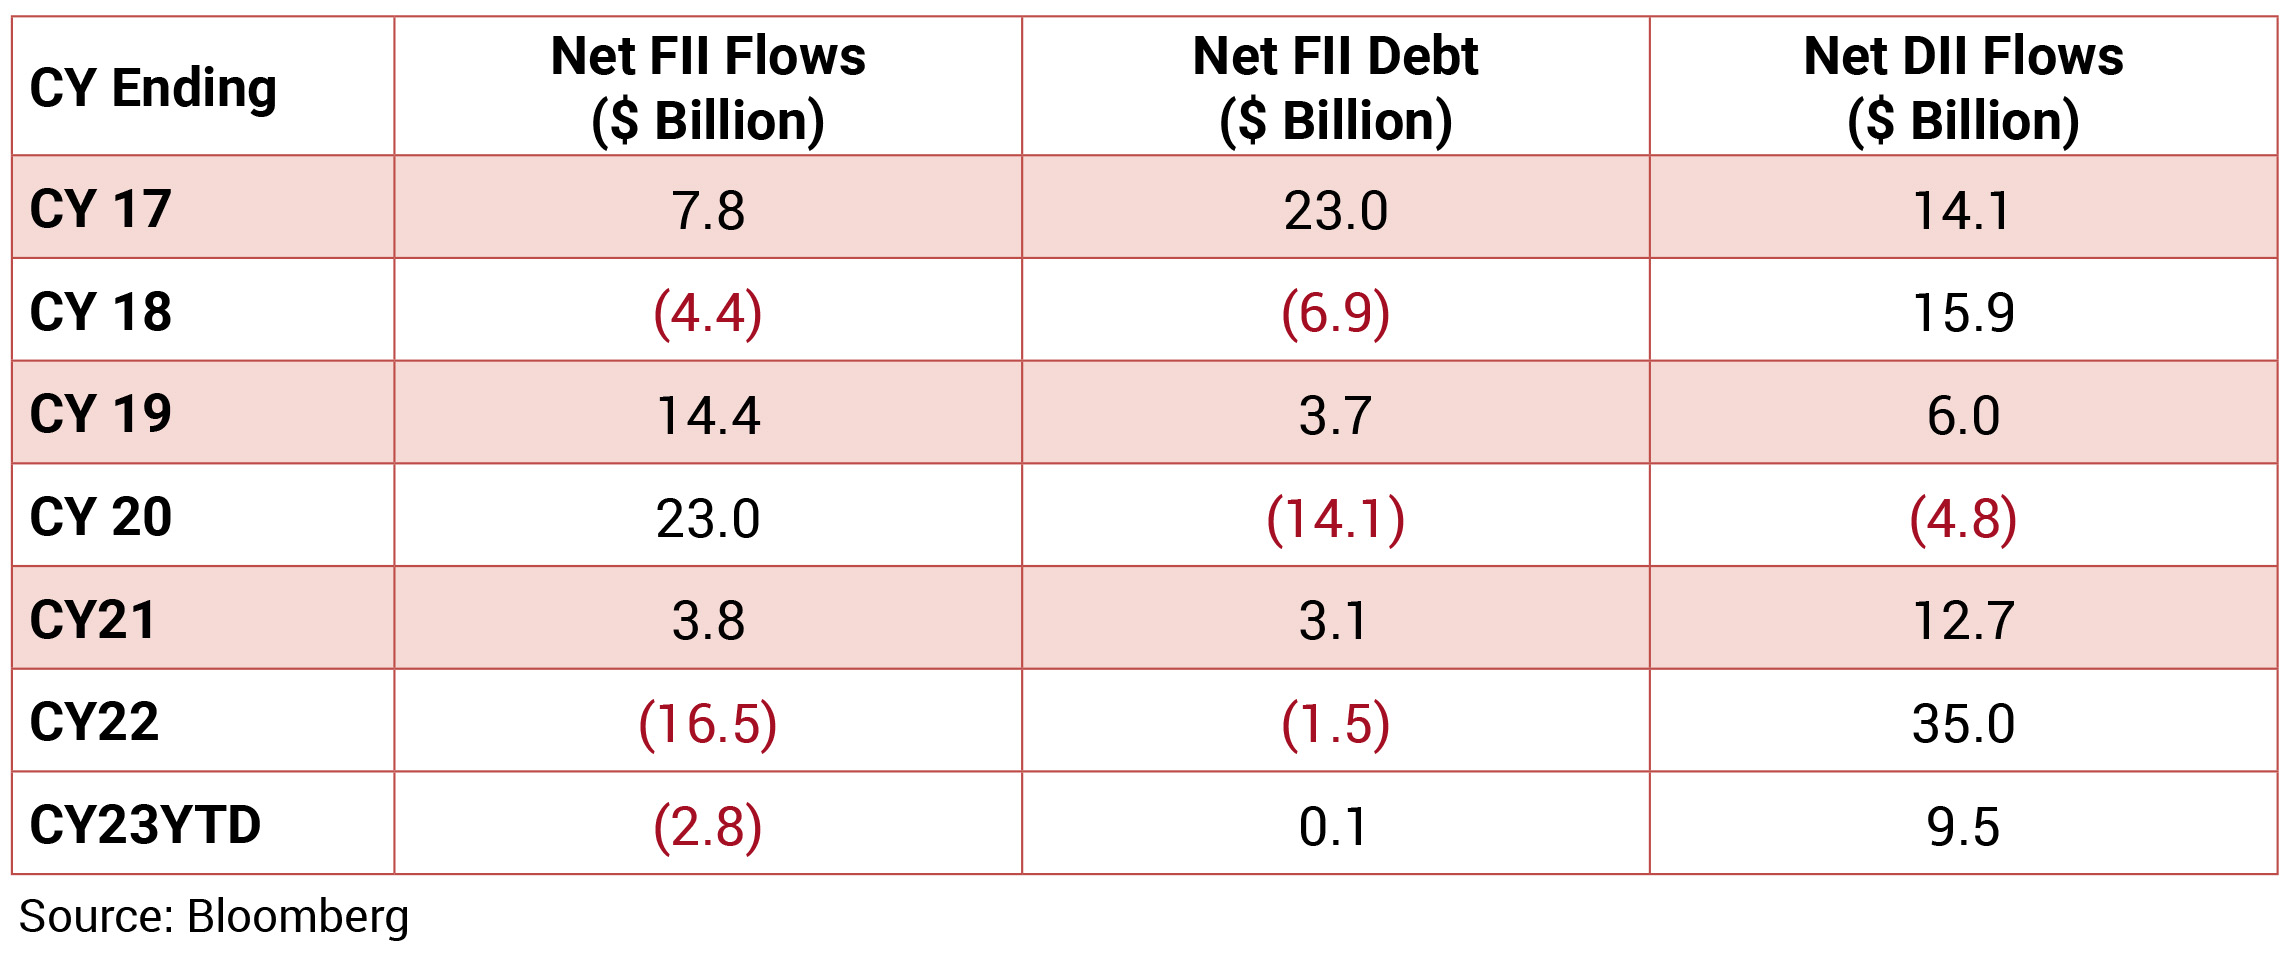
FIIs were net buyers in the month of March 2023 to the tune of USD 1.57bn and DIIs bought to the tune of USD 3.7bn.
FIIs were net buyers in the month of March 2023 to the tune of USD 1.57bn and DIIs bought to the tune of USD 3.7bn.

