Market Outlook
|
AS ON 30th June 2021
|
Month Gone By – Markets (period ended June 30, 2021)
U.S. equity benchmarks closed the first half of 2021 near record highs as the efforts to push
the economic recovery gushed through financial and monetary policies geared towards
it since the Q1 2020 and with central bankers providing continuous confidence to the
markets towrds continuation of policies to support growth. The S&P 500 closed the month
at 4297.5. The FOMC outcome on June 16th saw Federal Reserve officials accelerate their
pace of policy tightening and raising interest rates by late 2023, sooner than they earlier
expected, amid heating inflation and recovering labour market.
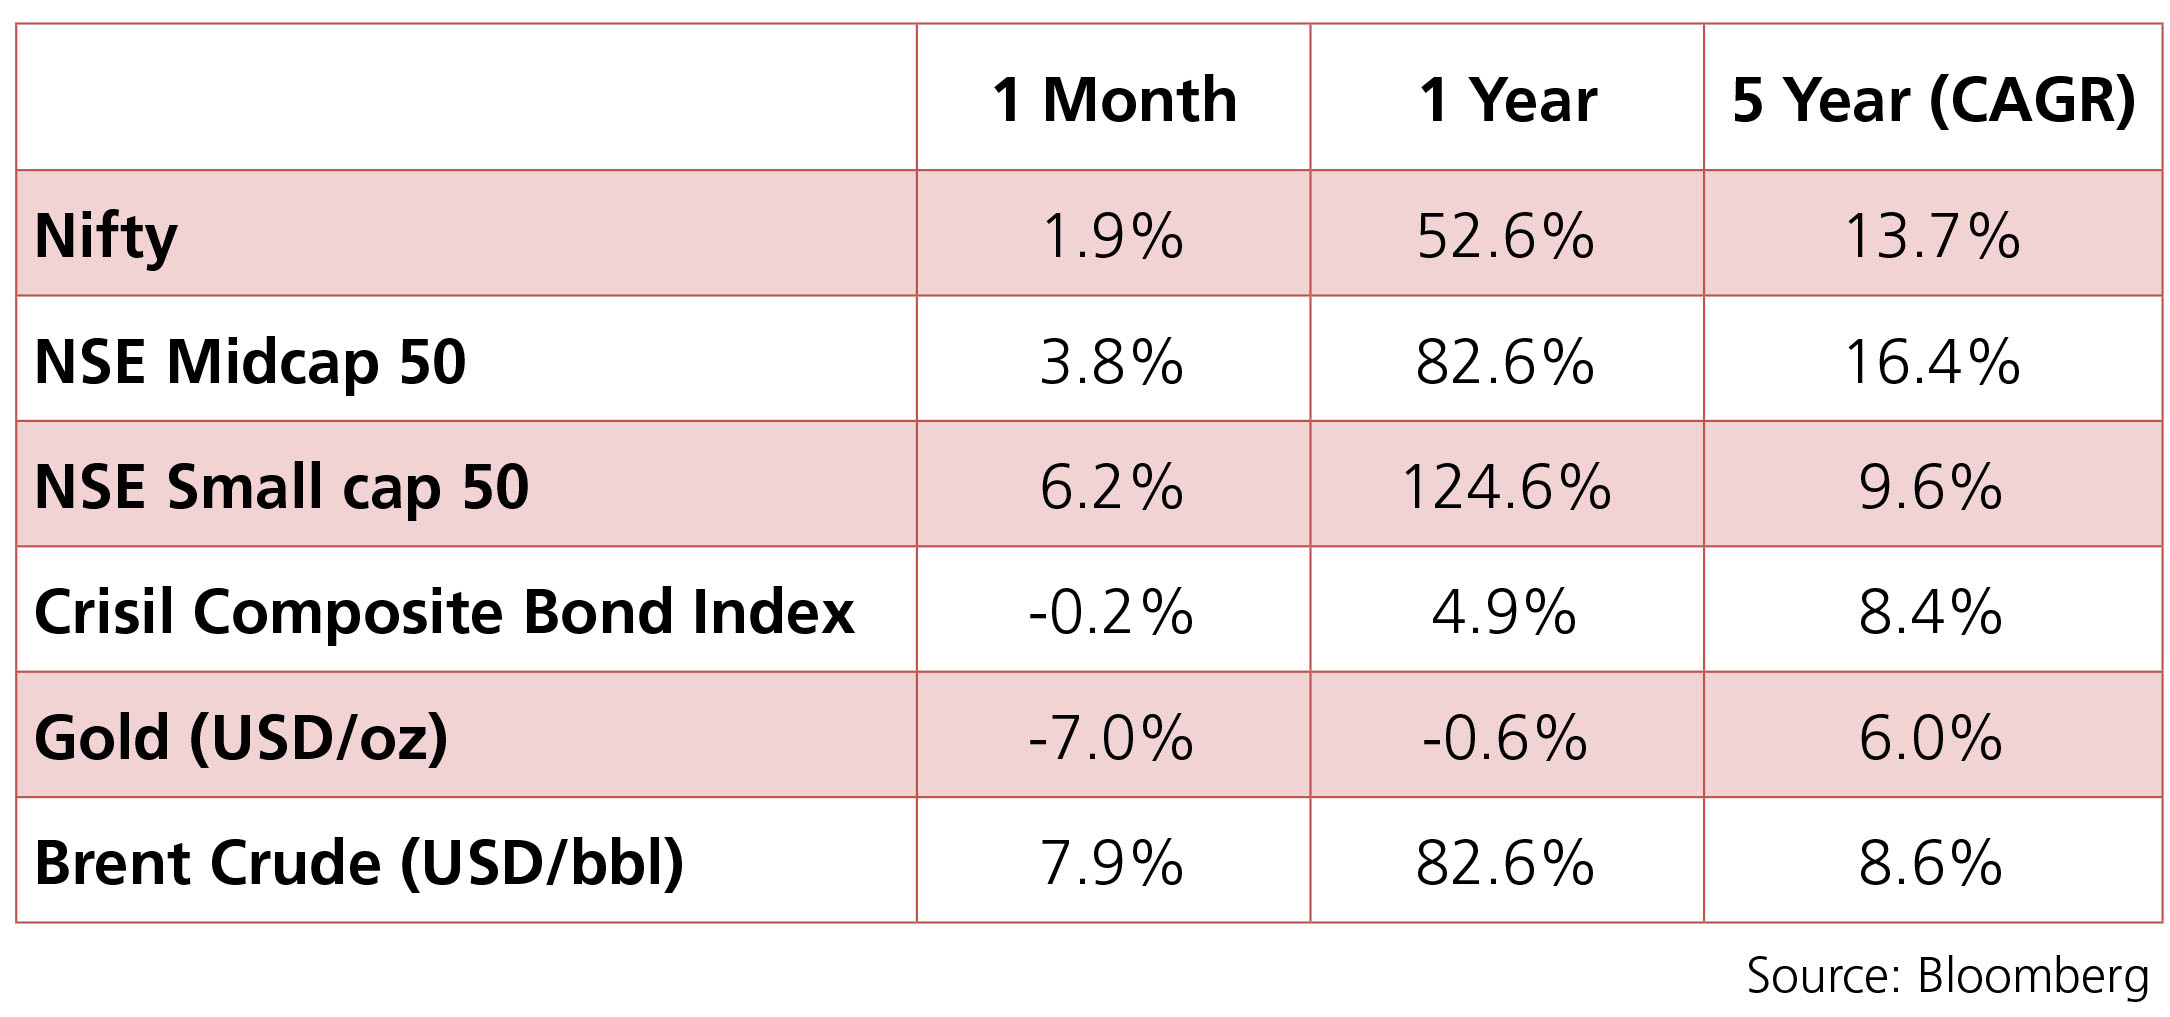
The Bloomberg Commodity Index which records an increase across various commodities recorded an increase from 94.14 on May 31st to 94.54 on June 30th, reflecting an increase in prices of crude and various industrial metals. However, gold saw a decline of almost 7% m-o-m on the back of sustained consumer backed inflation and FOMC held in June pointing towards monetary tightening.
The INR moderated from 72.51 on May 31st to 74.36 as DXY (the index which measures dollar strength against a basket of currencies) increased from 89.81 on May 31st to 92.24 on June 30th and the crude strengthened from $69 to $76 per barrel.
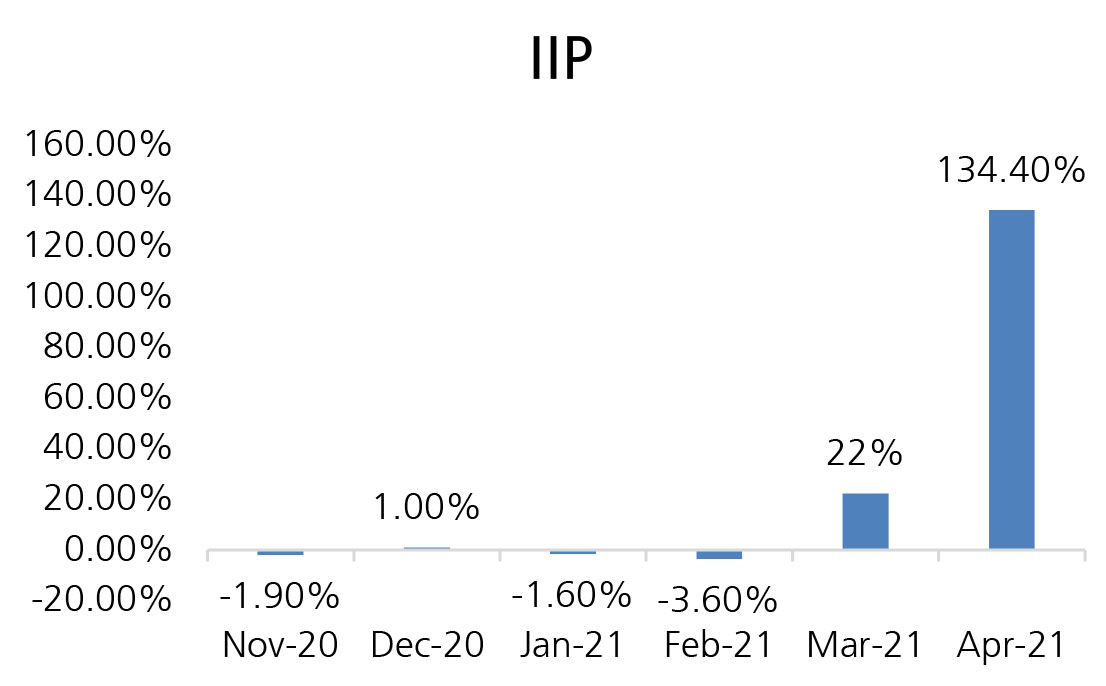
IIP: The country’s index of industrial production (IIP) surged 134.5% y-o-y to 126.6 in
the month of April 2021 primarily due to a low base in April 2020. However, the y-o-y
numbers are comparable in the strict sense as the numbers for April 2020 were not
computed by NSO due to the nation wide lockdown. However, on a m-o-m basis the
index recorded a fall of 13% as aptly reflected by a fall in GST by 28% collections for
the month.
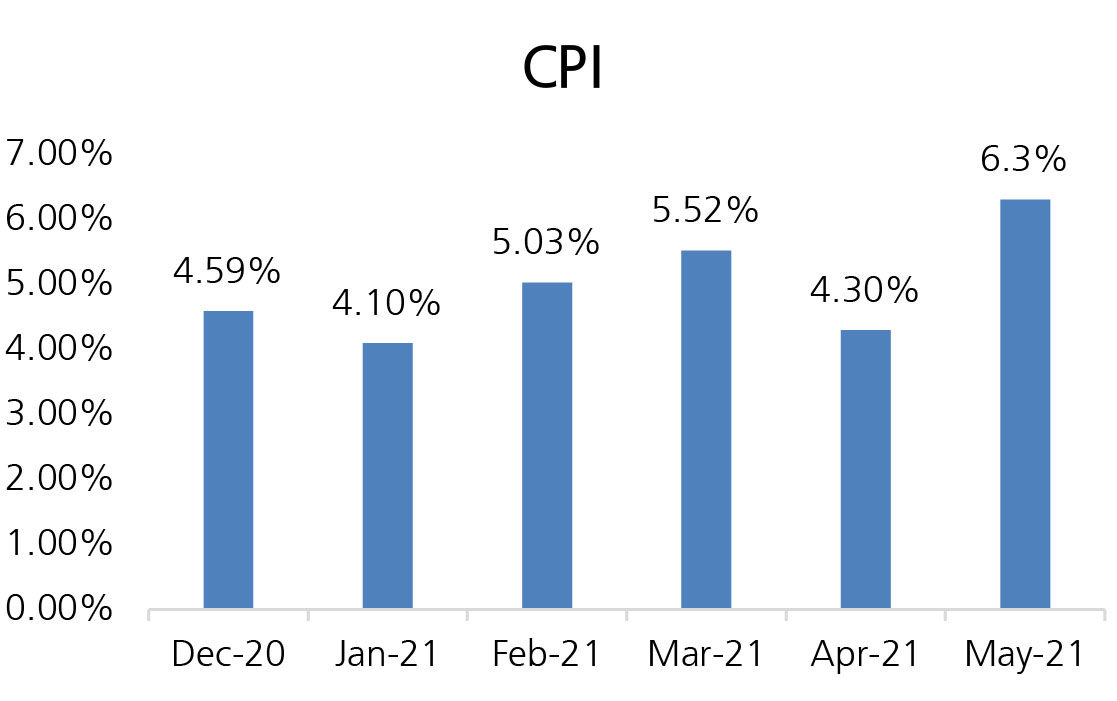
CPI: CPI for the month rose sharply to 6.3% vs 4.23% in April. On a m-o-m basis, the CPI went up by 1.6% owing to a 1.9% (5% y-o-y) increase in food prices led by oils and fats, eggs, vegetables, pulses, spices and fruits. Fuel and light inflation went up by 11.6% and by 2.2% sequentially. Rural inflation came in higher than urban inflation on the back of higher core inflation. Core inflation rose to 6.4% vs 5.1% in April. M-o-m, the core inflation grew 1.5%, led by a 2.6% increase in personal care, 2.2% in health, 2.1% in household goods and services and 2% in clothing and footwear.
Trade Deficit: The trade deficit for the month aggregated to $9.4 Bn vs a trade surplus of $0.7 Bn in June 2020 and a deficit of $16 Bn in June 2019 . The country’s exports came in at $32.5 Bn vs 22 Bn in June 2020 and $25 Bn in June 2019. Imports for the month increased by 96% over June 2020 to US$41.9 Bn due to lower base effect. Oil imports for the month rose to $10.68 Bn, as compared to $4.97 Bn in June 2020.
Fiscal Deficit: The fiscal deficit stood at 8.2% of the Budget Estimates, as compared to 59% in the same period last year. The main contributors to the lower fiscal deficit were higher tax revenues at 15.1% of BE vs 2.1% and net non tax revenues at 47.9% vs 2.8% in the same period last year. Similarly, even total expenditure 13.7% for the period vs 16.8% in the past period.
Deal activity picked up pace in June with 13 deals worth $4 Bn executed (vs 8 deals
worth $2.2 Bn in May) key ones being Standard Life’s stake sale in HDFC Life ($0.9 Bn),
Sona Comstar IPO ($0.7 Bn) & PE Stake Sale in SBI Cards ($0.7 Bn).
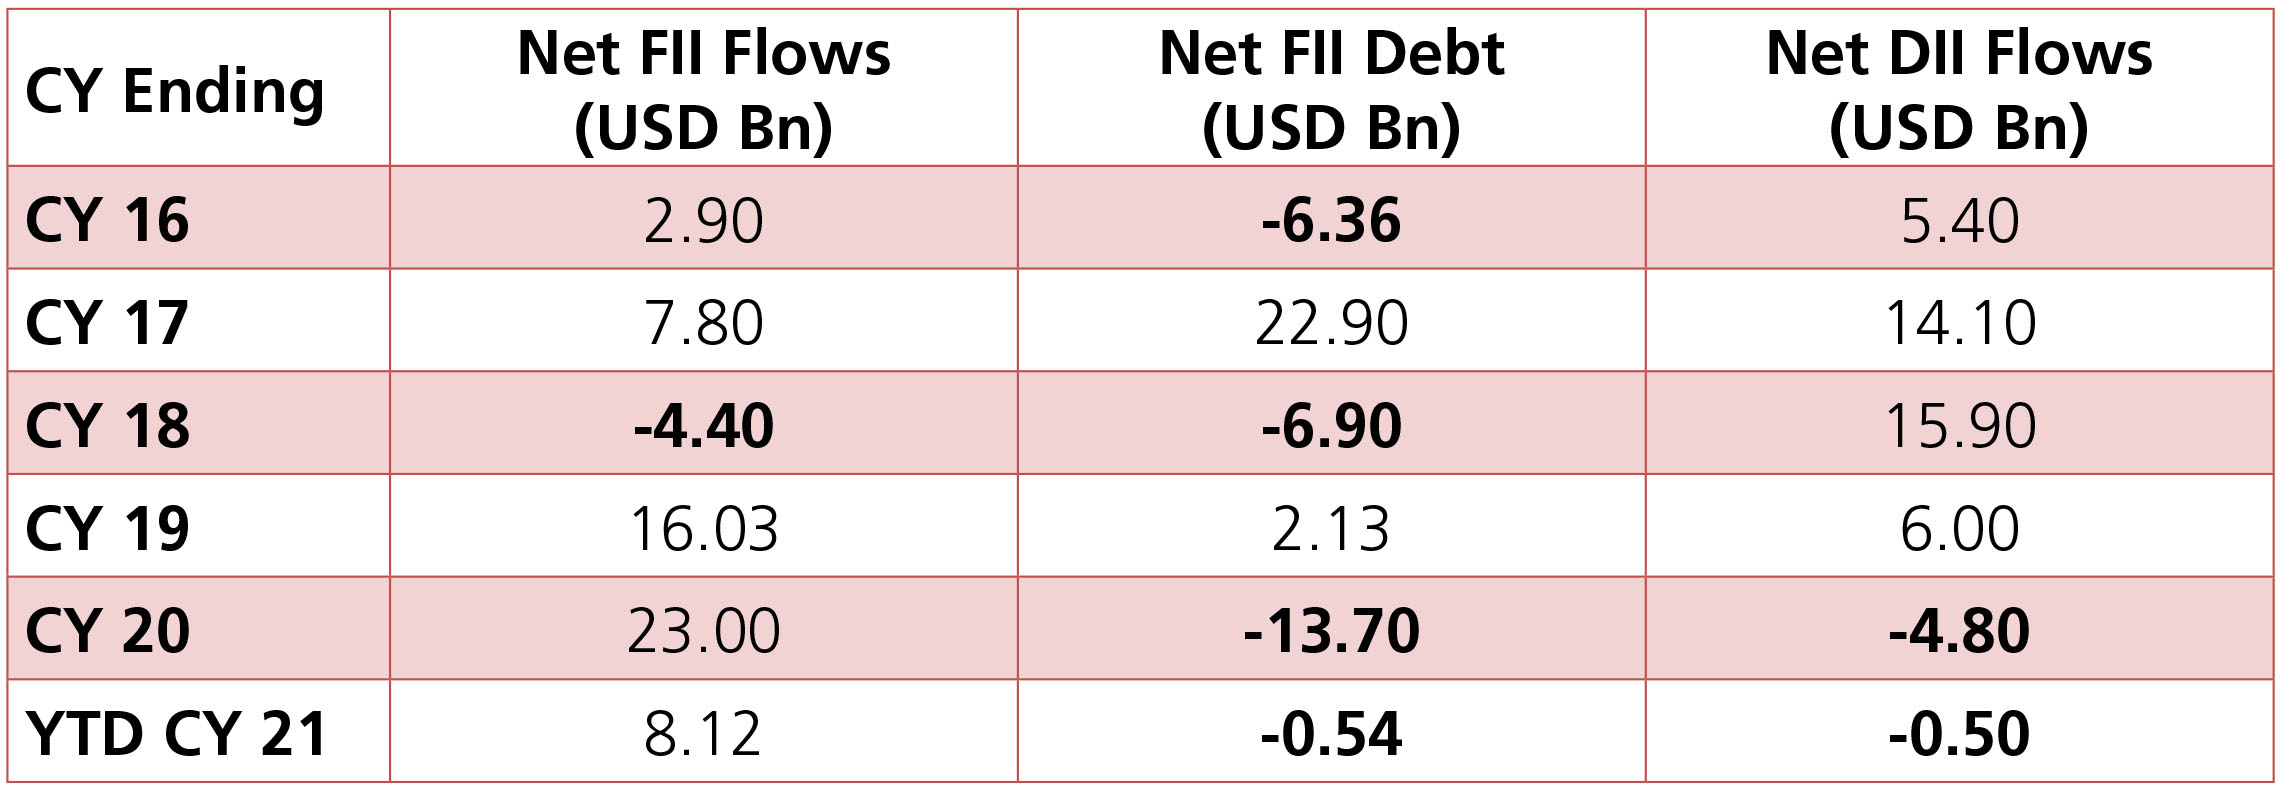
FIIs were net buyers in June to the tune of $1.4 Bn (thanks to FII participation in few block deals) vs $0.7 Bn in May, taking YTD inflows to $8 Bn. Notably, FIIs were sellers on most days in 2H of June. DII buying accelerated in June to $0.9 Bn (vs +$0.3 Bn in May), taking their YTD outflows to -$0.5 Bn.
FIIs were net buyers in June to the tune of $1.4 Bn (thanks to FII participation in few block deals) vs $0.7 Bn in May, taking YTD inflows to $8 Bn. Notably, FIIs were sellers on most days in 2H of June. DII buying accelerated in June to $0.9 Bn (vs +$0.3 Bn in May), taking their YTD outflows to -$0.5 Bn.
