Markets declined 3.5% mainly due to rising covid fears and FIIs outflows. IT, Energy and Financials have
been the laggards while Metal has been the frontrunner sector. The INR depreciated against USD after
slight relief in the previous month. It averaged around 82.52 with a monthly best and worst of 81.22 and
82.87 respectively. 10y benchmark yields traded in the range of 7.21%-7.33% and eventually ending the
month 5bps higher m-o-m at 7.33%. The 10y benchmark averaged 7.28% in December.
Inflation in US slowed for a fifth straight month to 7.1% in November with core goods witnessing deflation while EU saw inflation rate moderating for the first time since June 2021 to 10% from 10.6% in the previous month. In line with market expectations, FOMC slowed rate hike to 50bps in December. However, Fed chair continued to be hawkish as inflation continued to be much higher than the target. According to Fed projections, peak rate is now higher at 5.1% in 2023 and is expected to maintained for a longer term until inflation shows clear sign of trending back towards the 2% objective. ECB raised policy rates by 50bps, following two consecutive hikes of 75bps each while Bank of England also increased rates by 50bps, pushing the cost of borrowing in UK to the highest level since late-2008. Policy commentary and projections from global central banks indicated slowing economy in 2023 while inflation will remain elevated and well above the target throughout the year. Only clear indication of inflation moving towards mandated target will allow central banks to cut down on their policy rate.
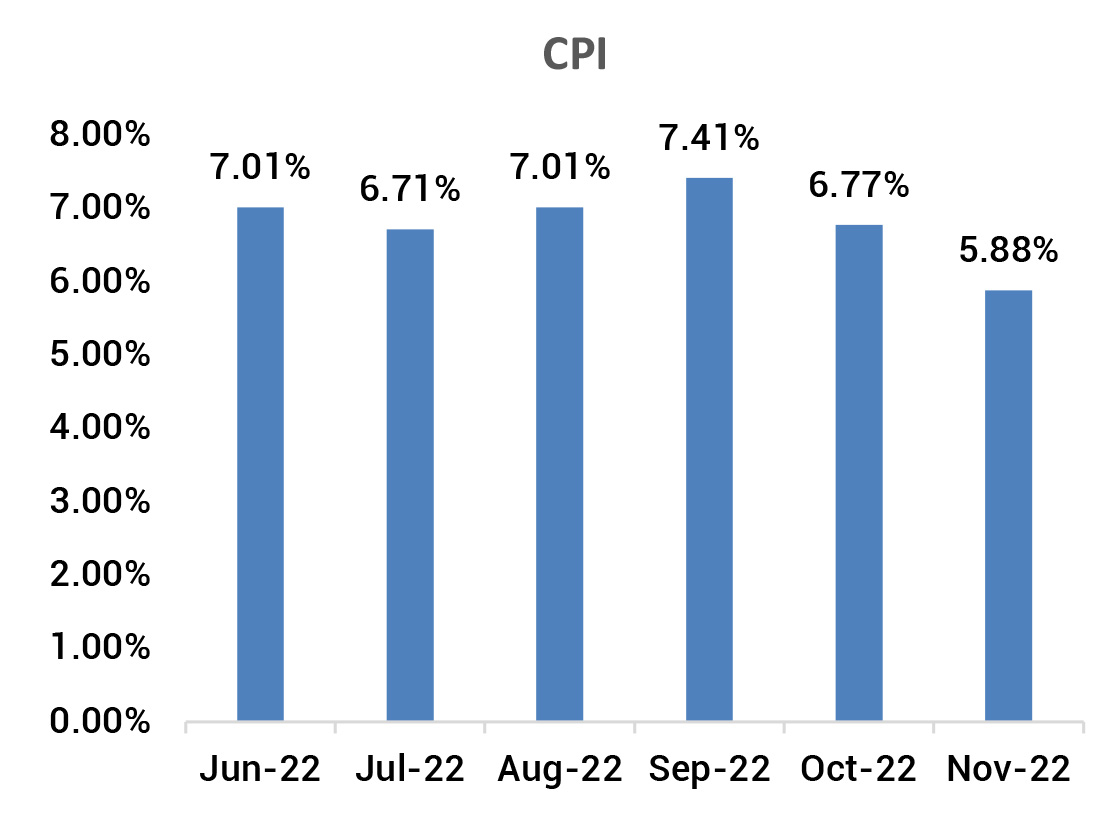
On the domestic front, high frequency data including GST collections and PMI indicated resilience and improvement in economic activity. Positively, CPI eased to 5.9% in November with correction in food prices. Food inflation saw -72bps sequential contraction. However, Core CPI remain elevated at 6.3% yoy with 43bps sequential increase. Responding to inflationary pressure, RBI followed the global central banks to maintain a hawkish stance while it delivered a smaller 35bps repo rate hike and retained the policy stance of withdrawal in accommodation. However, one of the MPC member suggested that economy is not in a condition to survive extreme monetary policy tightening. On the government expenditure, fiscal deficit rose to 59% of BE with strong capital expenditure at 60% of BE. Capex undertaken by road and rail ministries were robust at around 80% of BE.
Brent crude price softened to an average USD 81/bbl in December from USD 91/ bbl in November as recessionary concerns and covid restriction in China led to weakening demand outlook. Gold prices ended higher at USD 1,826/oz in December from USD 1746/oz in November., the pace of sequential price rise remains elevated across all segments. Some MPC members suggested at slower pace of rate hikes to gauge the impact of tightening till date. Fiscal situation is in control supported by buoyant tax revenue. Government focus on capex continue with road and railways capex spend extremely strong at around 75% of BE. High frequency data including GST collections point to resilient economic activity.
Brent crude price toned down to an average USD 91/bbl in November from USD 94/ bbl in October with recessionary concerns and covid restriction followed in China. Gold prices ended higher at USD 1,746/oz in November from USD 1,641/oz in October.


 Source: Bloomberg
MPC Minutes: The MPC voted with a 5-1 majority (Dr Varma voted against the repo rate hike) to raise the
repo rate by 35 bps to 6.25% while continuing to remain focused on the withdrawal of accommodation
(Dr Varma and Dr Goyal voted against this stance). Consequently, SDF and MSF rates increased to 6%
and 6.5%, respectively. The MPC’s reasons for monetary policy action was based on (1) keeping inflation
expectations anchored, (2) breaking the persistence in core inflation, and (3) containing second-round
effects of inflation. The MPC expressed optimism on growth, highlighting (1) sustained rebound in contactintensive
services supporting urban consumption, and (2) investment activity likely to be bolstered
by broad-based credit growth and the government’s thrust on capital spending. However, they were
increasingly wary of headwinds from (1) protracted geopolitical tensions, (2) tightening global financial
conditions, and (3) slowing global demand weighing on net exports. Accordingly, the MPC revised FY2023
real GDP growth to 6.8% (earlier 7%). The MPC retained its average FY2023 headline projection at 6.7%.
CPI: November CPI inflation at 5.88% (October: 6.77%) surprised sharply on the downside led by a steep sequential fall in food prices. Sequentially, headline inflation contracted by 0.1% (October: +0.8% mom) led mainly by a sharp fall in vegetable prices ((-)8.3% mom vs +4.1% mom in October), and fruits ((-)2% mom vs (-)1.1% mom in October). While vegetable prices moderated, cereal prices continue to push up food inflation. September core inflation (CPI excluding food, fuel, pan, and tobacco) remained steady at 6.3%. Sequentially, however, core inflation moderated marginally to 0.4% (October: +0.7% mom). Inflation in clothing and footwear remained high at 9.8% (October: 10.2%), followed by household goods and services at 7.7% (7.6%), and personal care and effects at 7% (7%) led again by gold and soaps.
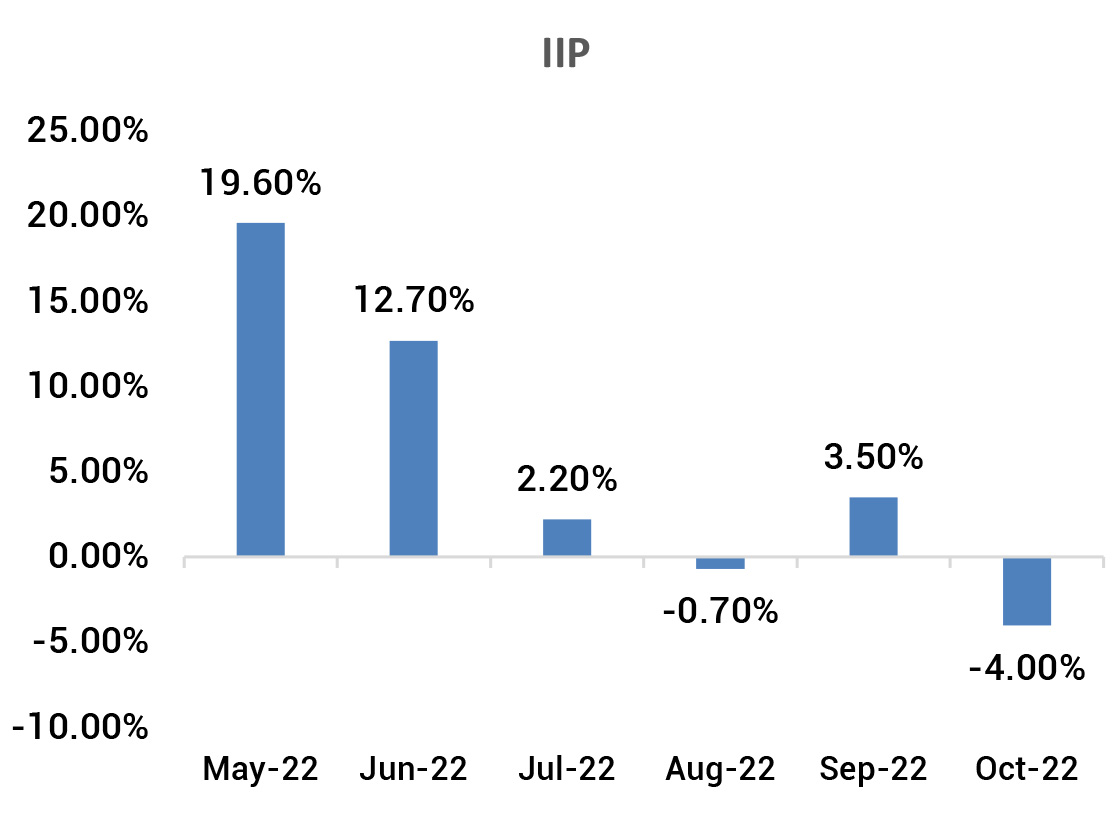
IIP: October IIP contacted sharply by 4% (September: +3.5%) while also contracting sequentially by 3.3% (September: +1.9% mom) given the holiday-truncated month. The decline was mainly led by a contraction in manufacturing activity by 5.6% (September: +2.2%) even as mining activity and electricity production registered positive growths. As per the use-based classification, all categories registered a contraction except for primary goods (2% yoy) and infrastructure goods (1% yoy). The consumer goods segment continues to remain a drag on factory activity.
Fiscal: Center’s gross tax revenue in 8MFY23 was 64.6% of FY2023BE (growth of 15.5%), while net tax revenue was 63.3% of FY2023BE (growth of 7.9%). Corporate tax collection in 8MFY23 was at 59.5% of FY2023BE (growth of 21.1%), whereas income tax collection was 64.9% of FY2023BE (growth of 25.6%). Expenditure in 8MFY23 was at 61.9% of FY2023BE in 8MFY23. This was mainly led by a rise in subsidies (94.7% of FY2023BE against 75.2% in 7MFY23). The strong pace in expenditure for roads and railways continued in 8MFY23 (79.6% and 84% of FY2023BE, respectively), though spending on roads in November slowed down to only Rs32 bn. GFD in 8MFY23 remained under check at 59% of FY2023BE.
CAD: CAD in 2QFY23 widened to USD 36.4bn, which is 4.4% of GDP (1QFY23: USD 18.2bn and 2.2% of GDP), mainly due to widening of the trade deficit to USD 83.5bn (1QFY23: USD 68.6bn), as imports increased sharply and exports moderated. Meanwhile, services and transfers surprised on the upside, with the net invisible inflows having increased to a record quarterly high of USD 47bn (1QFY23: USD 45bn). Consequently, 1HFY23 CAD/GDP came in at 3.3% (1HFY22: (-)0.2%). Capital account surplus in 2QFY23 moderated to USD 7bn (1QFY23: USD 22bn), mainly due to banking capital outflows of USD 8bn (1QFY23: +USD 19bn). FDI inflows in 2QFY23 also moderated sharply to USD 6bn (1QFY23: USD 14bn), whereas FPIs turned buyers in 2QFY23, recording inflows of USD 7bn (1QFY23: (-)USD 15bn). Consequently, the BOP turned sharply negative, registering a deficit of USD 30.4bn (1QFY23: +USD 4.6bn).
Trade: November exports at USD 32bn (October: USD 31.4bn) was 0.6% higher than in November last year (+1.9% mom). The increase was mainly due to a rise in non-oil exports to USD 26.6bn (October: USD 25.1bn), led by engineering goods at USD 8.1bn (October: USD 7.4bn) and electronic goods at USD 2.2bn (USD 1.9bn). November imports, at USD 55.9bn, increased 5.4% yoy, but declined by 5.3% mom (October: USD 59bn). This was mainly due to a fall in oil imports to USD 15.7bn (October: USD 18.2bn); non-oil imports fell only marginally to USD 40.1bn (USD 40.8bn). The lower oil import bill was mainly due to moderation in crude oil prices in September-October. Trade deficit in November narrowed to USD 23.9bn (October: USD 27.6bn) and stood at USD 198.3bn in 8MFY23 (8MFY22: USD 115.4bn).

Deal flow slowed down in December with deals worth ~USD1.6bn executed, even though number of deals
increased to 36. Key deals included IRCTC (USD 165mn) and PB Fintech (USD 129mn).
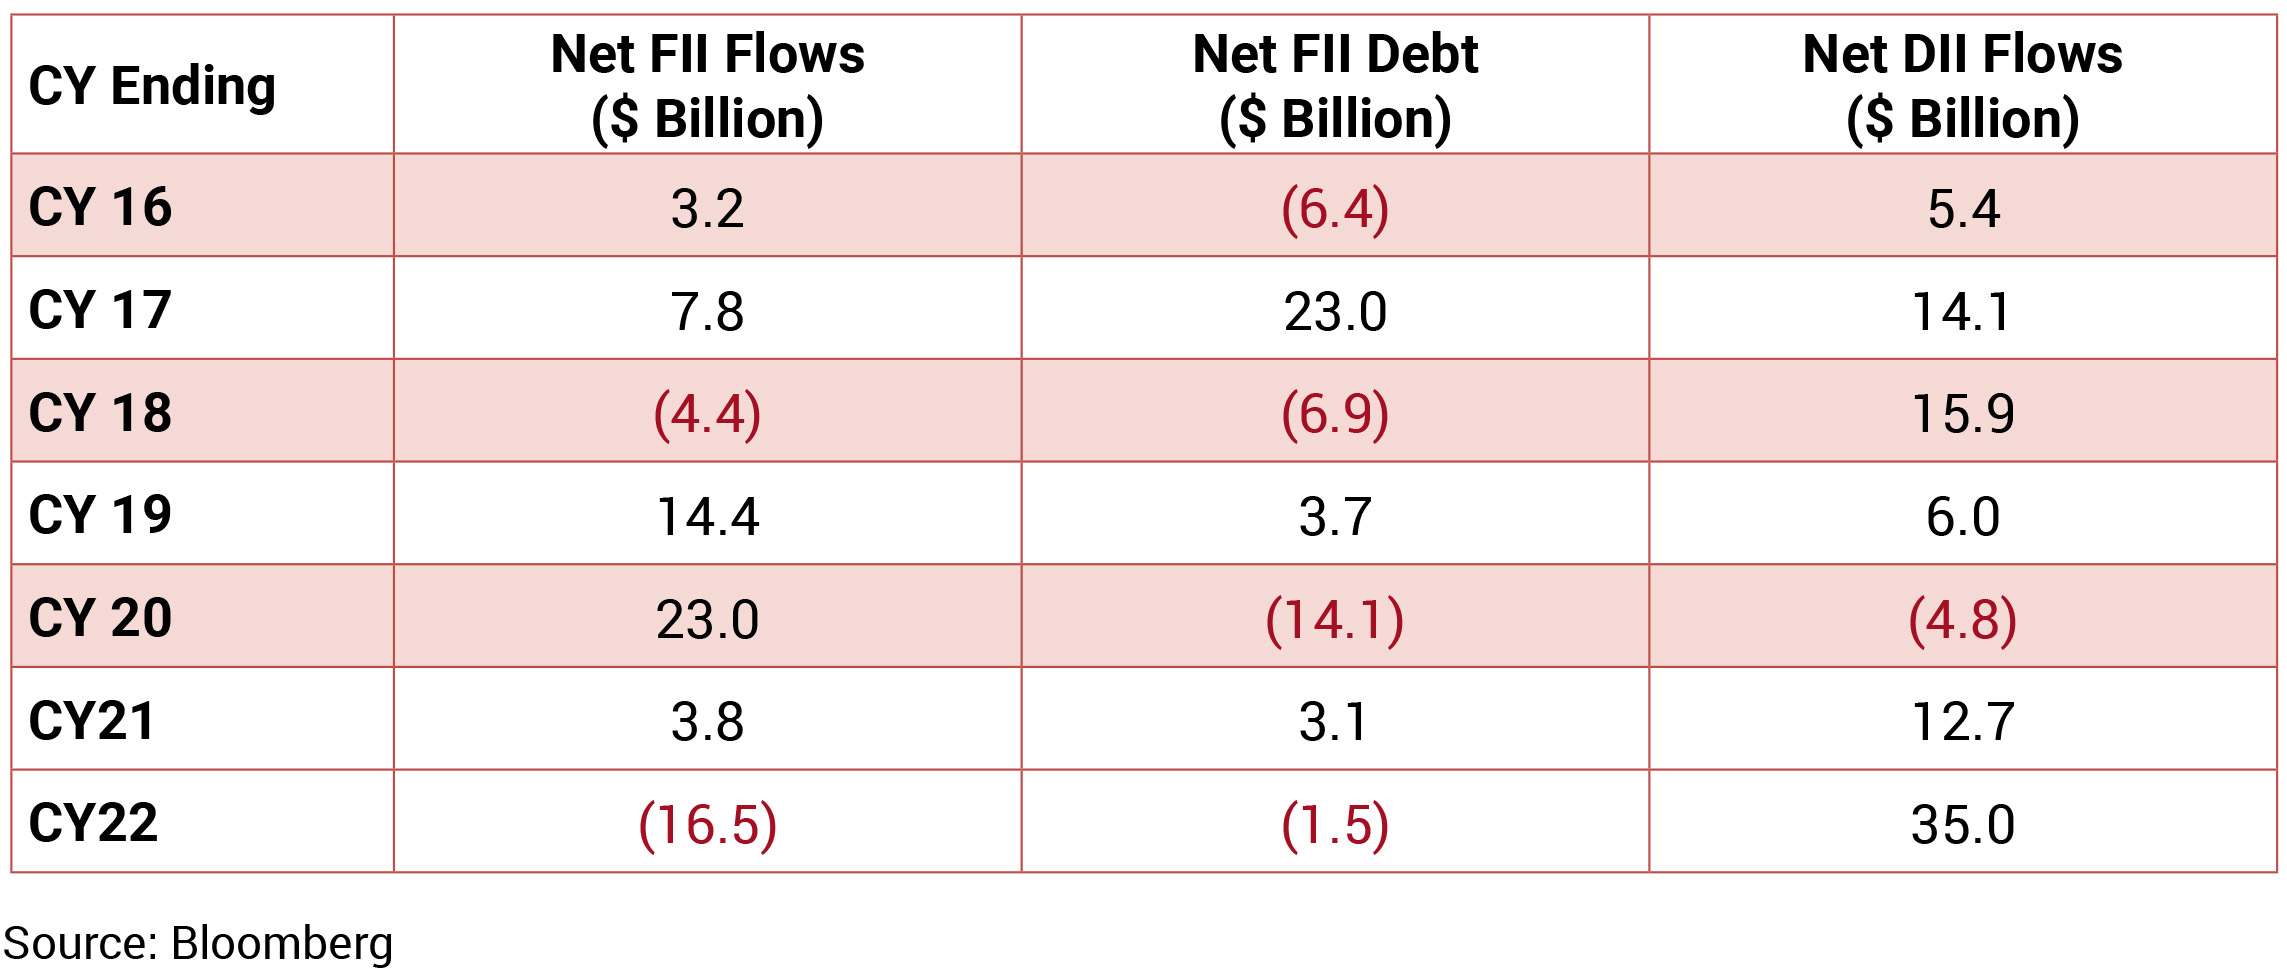
FIIs significantly reduced their buying in December 2022, although they remained net buyers to the tune of USD 263mn. DIIs turned net buyers to the tune of USD 2.93bn.
FIIs significantly reduced their buying in December 2022, although they remained net buyers to the tune of USD 263mn. DIIs turned net buyers to the tune of USD 2.93bn.

