Market Outlook
|
AS ON 30th September 2021
|
Month Gone By – Markets (period ended September 30, 2021)
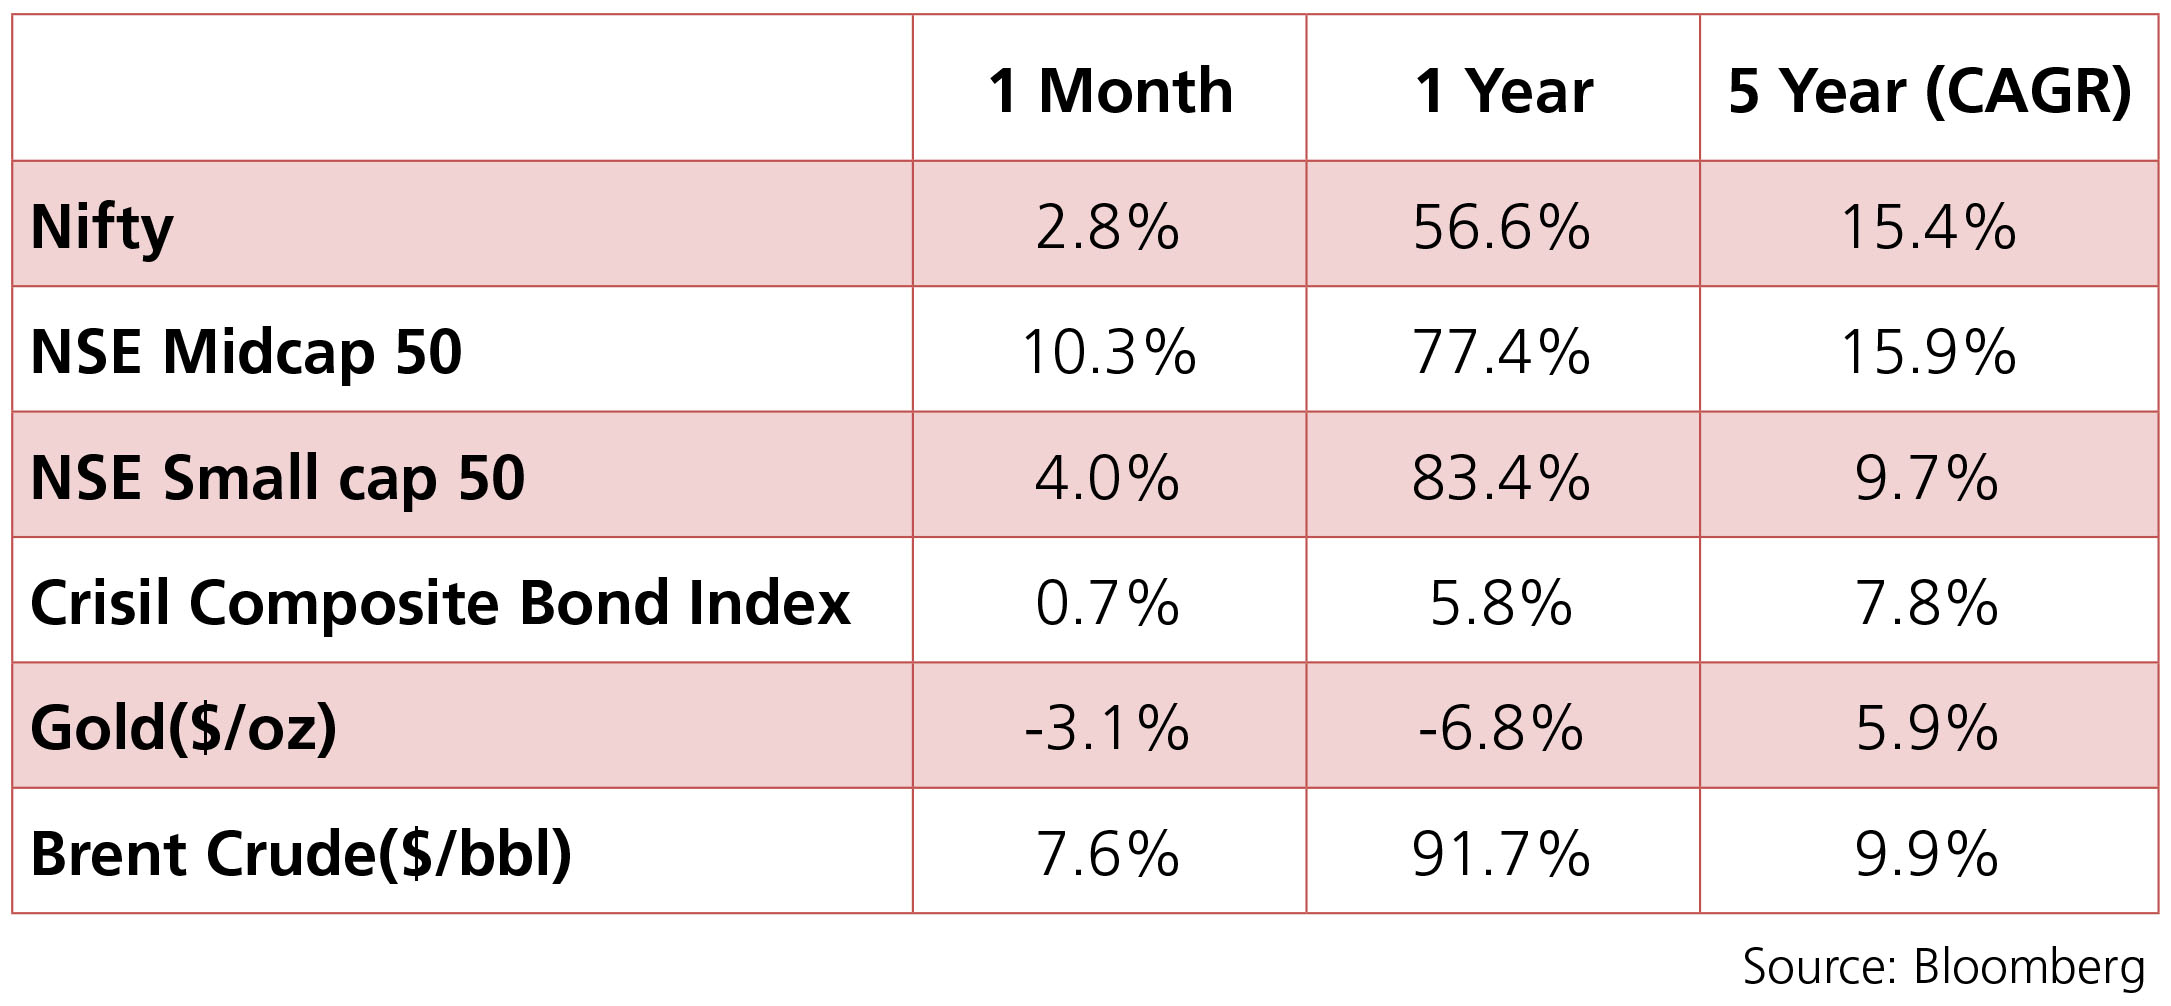
Markets continued to tick up in the month of September although they scaled back from the highs
registered during the month. The Nifty index was up 2.8% for the month of September. Realty, Telecom
and Utilities have been the frontrunner sectors while Metals and Materials have been the laggards. The
INR has been broadly on a depreciating trend over the month. Energy prices have been on a boil and
that has put pressure on the Indian Rupee. The 10y benchmark averaged at 6.18% in September and
ended the month flat at 6.22%.
One of the major events for the month of September was the Fed signalling that tapering could begin this year. FOMC members generally believe that asset purchases could be completed by middle of 2022, which would mean an announcement of tapering could come as soon as Novermber with the actual tapering beginning in December implying a faster rate of tapering this time than in 2013. As per the FOMC dot plot, the median projection of Fed rate lift-off has been advanced to 2022 as opposed to 2023 (June FOMC projection). Further, FOMC now projects 3 rate hikes by end 2023 compared to 2 hikes in the previous projections. Nonetheless, Jay Powell mentioned that criteria for lift-off will be a lot more stringent than criteria for tapering.
In the eastern part of the world, China saw the emergence of a crisis arising from real-estate giant Evergrande on the brink of default. Evergrande is China’s second largest real estate company, owns more than 1300 projects in 280 cities, has 200,000 employees and its equity and debt is included in indices across Asia. After expanding rapidly for years and snapping up assets as China’s economy boomed, Evergrande is now snowed under a crushing debt of USD 300bn. While Evergrande by itself is huge but a global financial contagion is unlikely given that China is an inward looking economy financially. However, a slowdown in the Chinese economy is quite possible and consequently the world economy.
In commodities, brent crude averaged USD 74.5/bbl as energy prices soared over the month. Brent crude was up 11% and Natural gas price was up 27%. The OPEC+ is expected to agree on raising output in its next meeting to ease the price pressure so as not to weaken the post-pandemic global recovery. Gold ended the month weaker by 3% as the risk assets continue to dominate globaly.
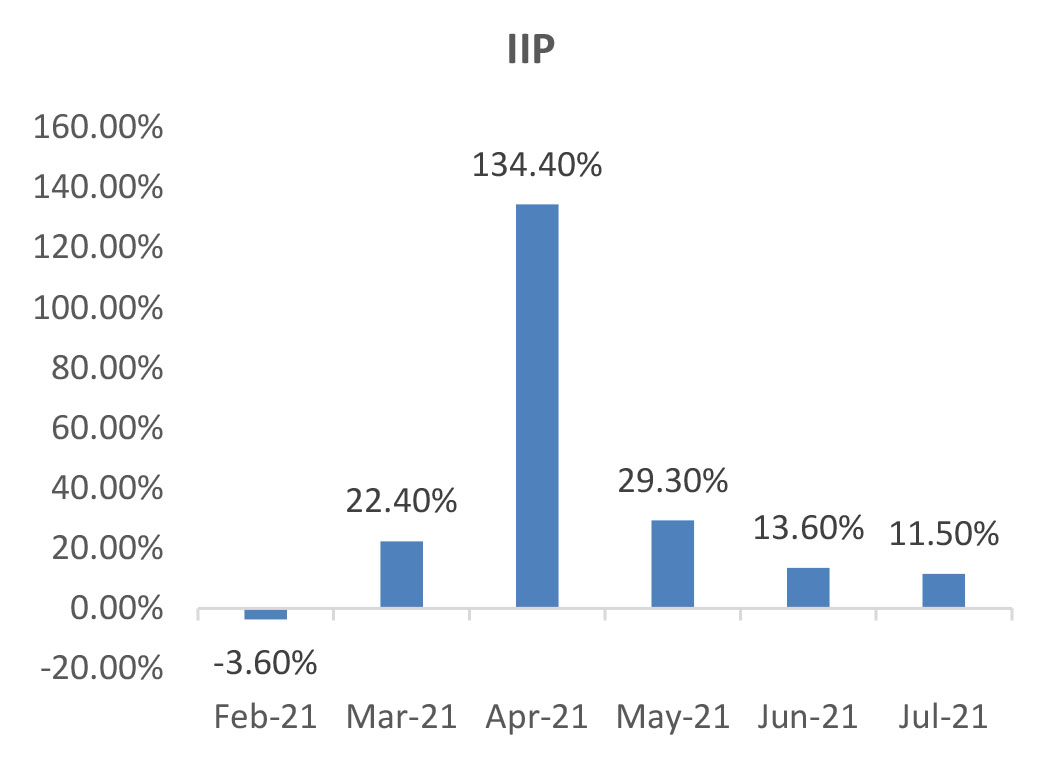
IIP: July IIP registered an uptick of 11.5% (June: 13.6%) led largely by a pick-up in sequential
momentum (7.2% mom). On a sectoral basis, mining activity picked up by 19.5% yoy (June: 23.1%),
electricity production by 11.1% (8.3%), and manufacturing activity by 10.5% (13%). Compared
to July 2019, IIP was 0.3% lower, with manufacturing activity lower by 2.1%. However, electricity
production and mining activity were higher by 8.3% and 4.4% respectively. As per the use-based
classification, capital goods production grew by 29.5% (June: 26.6%), consumer durables by 20.2%
(27.9%), and intermediate goods by 14.1% (22.7). Meanwhile, consumer non-durables production
continued to remain weak for the second time in a row ((-) 1.8% compared to (-)4.5% in June)
signaling persistence of fragmented pickup in demand.
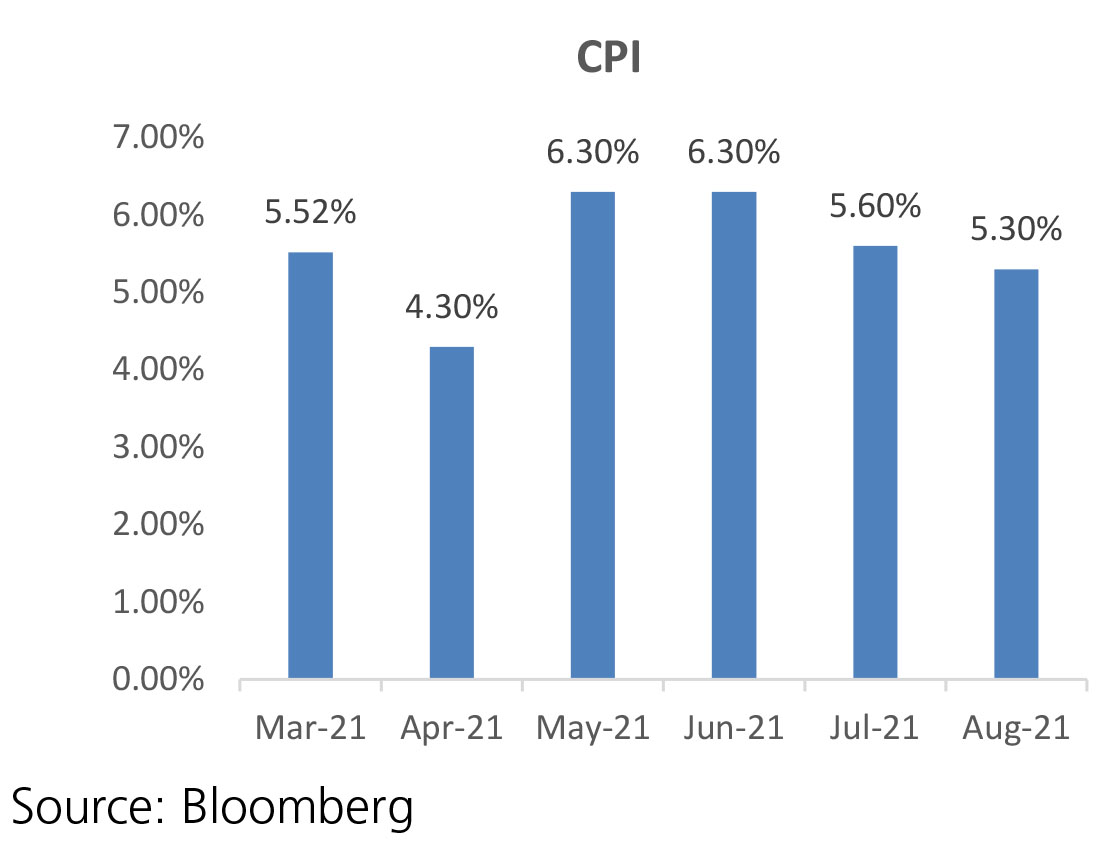
CPI: August CPI inflation moderated to 5.3% (June: 5.59%) led largely by lower-than-expected food inflation even though core inflation remained elevated. Sequentially, the headline CPI increased 0.2% (compared to 0.7% mom in July). Food and beverages inflation eased to 3.8% compared to 4.5% in July with the food index declining sequentially by 0.1% (+1% mom in July) led by fall in prices of meat and fish, eggs, fruits, and pulses. Core inflation (CPI excluding food, fuel and pan, tobacco) remained flat from July at 5.9% but rose sequentially by 0.5% mom (0.7% mom increase in July). Prices increased across all categories except personal care which declined by 0.1% mom.
Trade Deficit: Trade deficit in September increased sharply to USD 22.9bn (August: USD 13.8 bn) and USD 78.4bn in 1HFY22 (USD 25.9bn in 1HFY21 and USD 88.9bn in 1HFY20). Exports in September increased 21.3% to USD 33.4bn, growing sequentially by 0.5% (July: USD 33.3 bn). Non-oil exports at USD 28.5bn increased 18.7% but declined by 0.2% sequentially. Imports in August rose sharply by 84.7% to USD 56.3bn while increasing sequentially by 19.7% (July: USD 46.4bn). Non-oil imports grew 57.8% to USD 38.9bn (9.9% sequentially). The sharp rise in imports was due to oil imports at USD 17.4bn (50% sequentially) and electronics imports at USD 6.9bn (16.4% sequentially).
Fiscal Deficit: The fiscal deficit stood at 31.1% of the Budget Estimates, as compared to 109.3% in the same period last year. In absolute terms, the fiscal deficit was at Rs 4,68,009 crore at the end of August. The main contributors to the lower fiscal deficit were higher net tax revenues at 41.7% of BE vs 17.4% in the corresponding period previous year and non-tax revenues at 61.2% vs 22.4% in the same period last year. At the same time, total expenditure was lower at 36.7% for the period vs 41% in the same period last year.
Deal flow moderated in September with 16 deals worth ~USD 2.2bn executed (vs 18
deals worth ~USD 3 bn in August). Notable deals included stake sales in SBI Cards
(~USD 443mn), HDFC AMC (~USD 411mn) and SBI Life (~USD 366mn).
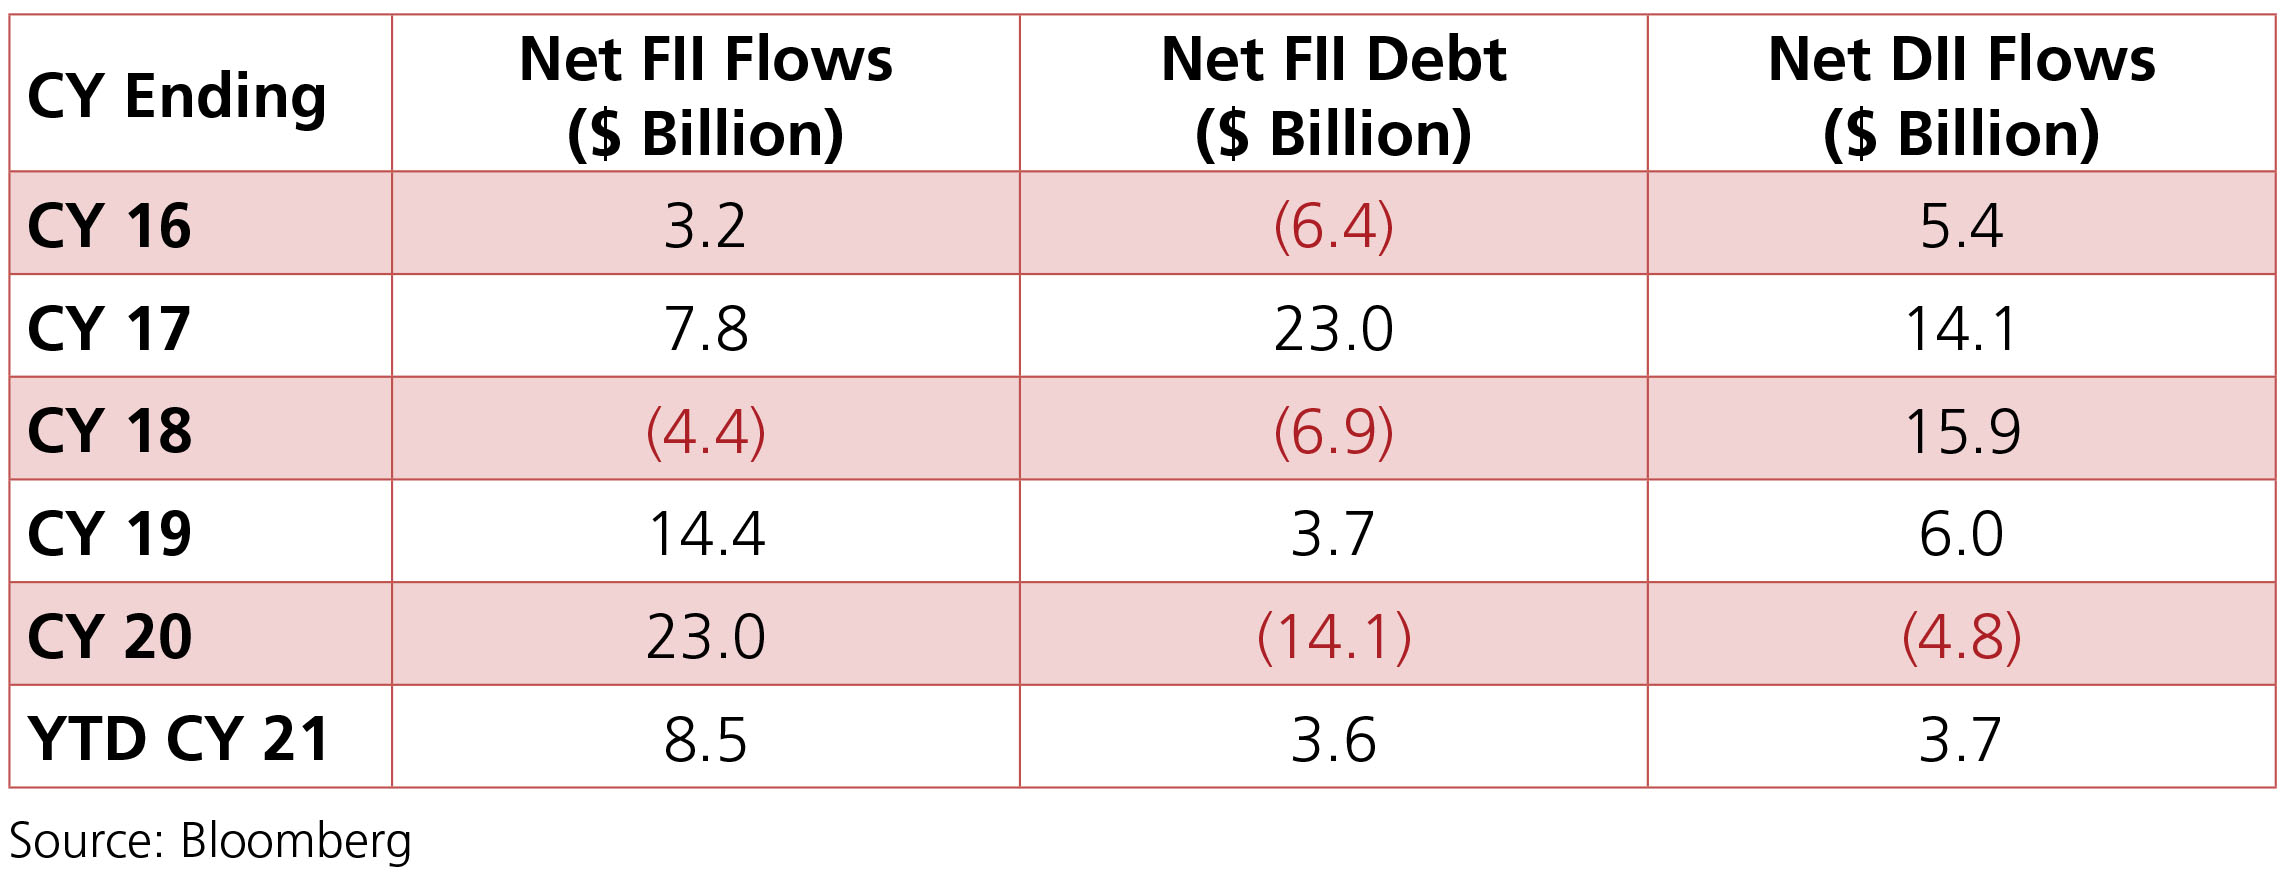
FIIs were net buyers to the tune of +USD 1.1bn in September (YTD +USD 8.5bn) vs +USD 1bn in August while DII buying was +USD 0.8bn (YTD + USD 3.7bn) vs +USD 0.9bn in August. DII buying was largely driven by Domestic MFs who bought +USD 0.9bn (YTD +USD 3.7bn).
FIIs were net buyers to the tune of +USD 1.1bn in September (YTD +USD 8.5bn) vs +USD 1bn in August while DII buying was +USD 0.8bn (YTD + USD 3.7bn) vs +USD 0.9bn in August. DII buying was largely driven by Domestic MFs who bought +USD 0.9bn (YTD +USD 3.7bn).
