Market Outlook
|
AS ON 30th September 2020
|
Month Gone By – Markets (period ended September 30, 2020)
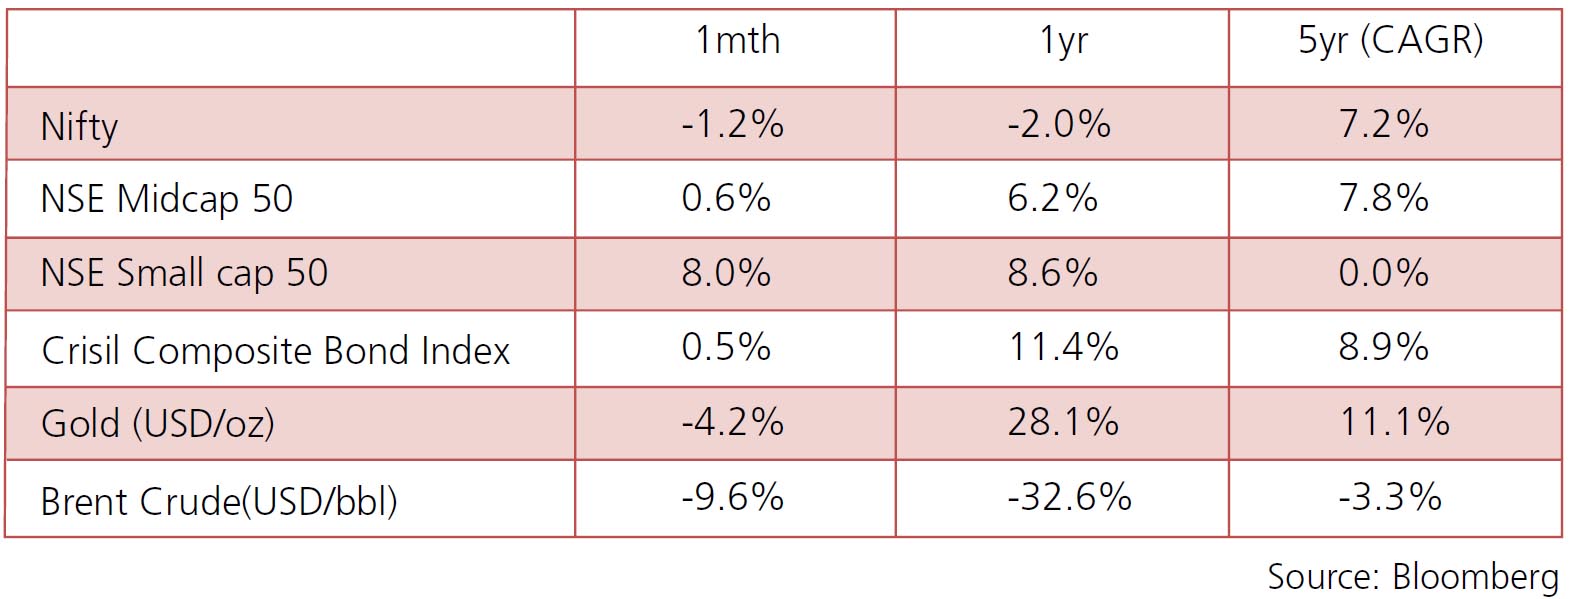
Indian Equities were in for a volatile ride in September before recording a minor fall for the month
(Nifty -1.2%). The main casuses of volatility were fading hopes of proposed US Stimulus worth USD2.4
Trillion, rise in Covid cases and flaring up of Indo China conflicts along LAC. Gold which has been the
best performing asset class for the year with its reputation as a heaven asset, recorded a steep fall in
September (XAU/USD -4.2%) owing to dollar strengthening and fall in inflation expectations. NSE Small
Cap 50 continued its streak of stellar returns after SEBI announced change in asset allocation norms of
multi-cap funds.
The US 10Y yields continued to be stable post US Fed outcome on September 16th providing guidance by resolving to keep shot term rates anchored near zero through 2023 as well as allowing inflation to run marginally beyond 2% before hiking rates to control inflation.
Brent oil price recorded a fall of 9.6%, closing at USD40.96/bbl on grounds of increased production by Iran and Libya; reduction in prices by Saudi Aramco and fall in aggregate demand by the troubled aviation industry.
INR traded in the range of Rs 73.01-73.90/$ for the month of September bolstered by dollar inflows into Reliance Retail, RBI’s building of forex reserves and IPOs.
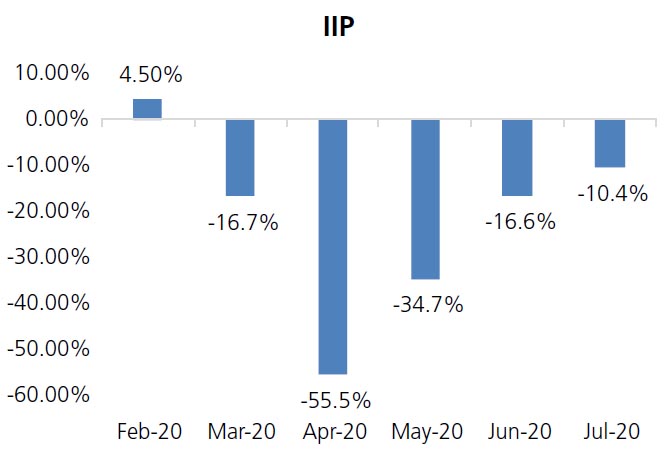
IIP: Index for Industrial Production for Jun contracted 10.4% (vs. 16.6% contraction in June). Highest fall was
recorded by consumer durables (-23.6%) followed by capital goods (-22.8%) with consumer non-durables the
only category recording a modest growth of 6.7%. However, the growth is only half of what was recorded in
the previous month reflecting a fall in restocking of inventory levels.
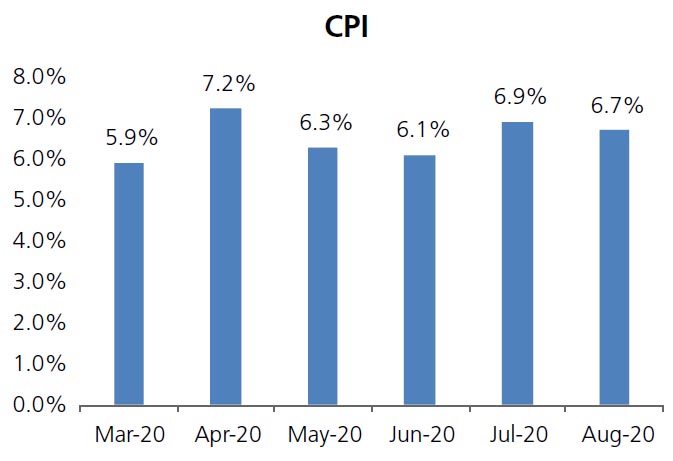
CPI: Headline CPI for August came in at 6.7% vs expectations of 6.9%. The headline CPI for the month of July was also revised downwards from 6.9% to 6.76%. The biggest drivers of inflation can be seen as vegetables recording +11.41% y-o-y, and protein basket recording an increase of +15.30% on the food side; and transport & communication recording y-o-y +11.05% and personal care and effects +14.45%.
Trade Deficit : India’s trade balance turned to a deficit of ~USD 6.77 bn in August 2020 vs USD 13.4 bn in August 2019. The fall in trade deficit was outcome of contraction in exports by 12.66% and contraction of imports by 26%. Oil imports declined by 41.62% to USD 6.42 bn y-o-y, whereas gold imports jumped to USD 3.7 bn in August as against USD 1.36 bn in the same month last year.
Fiscal Deficit: : India’s fiscal deficit stood at Rs8.7 tn at the end of August, at 107% of the budgeted target for the current fiscal year vs 79% last fiscal year. This can be attributed to fall in total receipts to 17% of the budgeted revenue vs 30% last fiscal, while total expenditure continues to be at 42% of budgeted which is similar to last year’s digits.
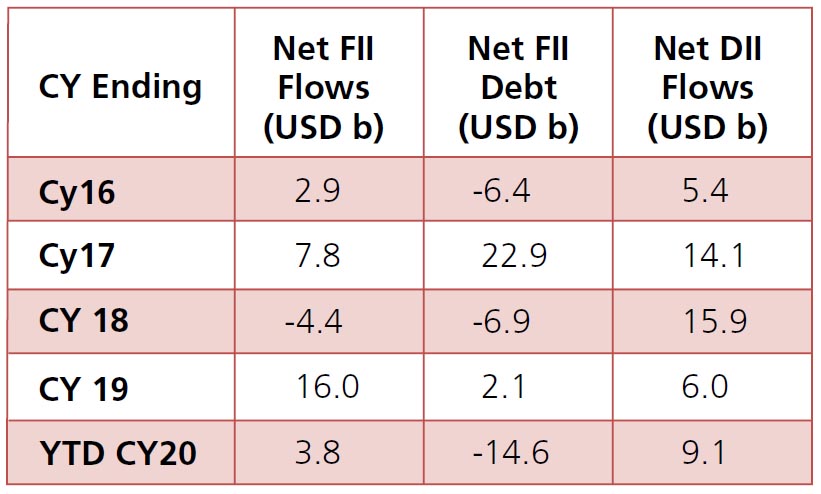
In flow trends, after 4 months of consecutive net
buying, FIIs turned net sellers in September of
~USD1.05bn, lowering their YTD inflows to USD
3.8bn. DIIs were marginal buyers (+USD12mn)
taking their YTD inflows to USD 9.1bn. Domestic
MFs were net sellers ~USD0.6bn (YTD +USD2.4bn)
likely driven by redemptions while Other DIIs were
buyers of ~USD0.6bn (YTD +USD6.6bn). FIIs turned
marginal buyers of debt markets at USD 0.5bn in
September. YTD, FIIs have sold USD 14.6bn in the
debt markets.
