Market Outlook
|
AS ON 31st December 2021
|
Month Gone By – Markets (period ended December 31, 2021)
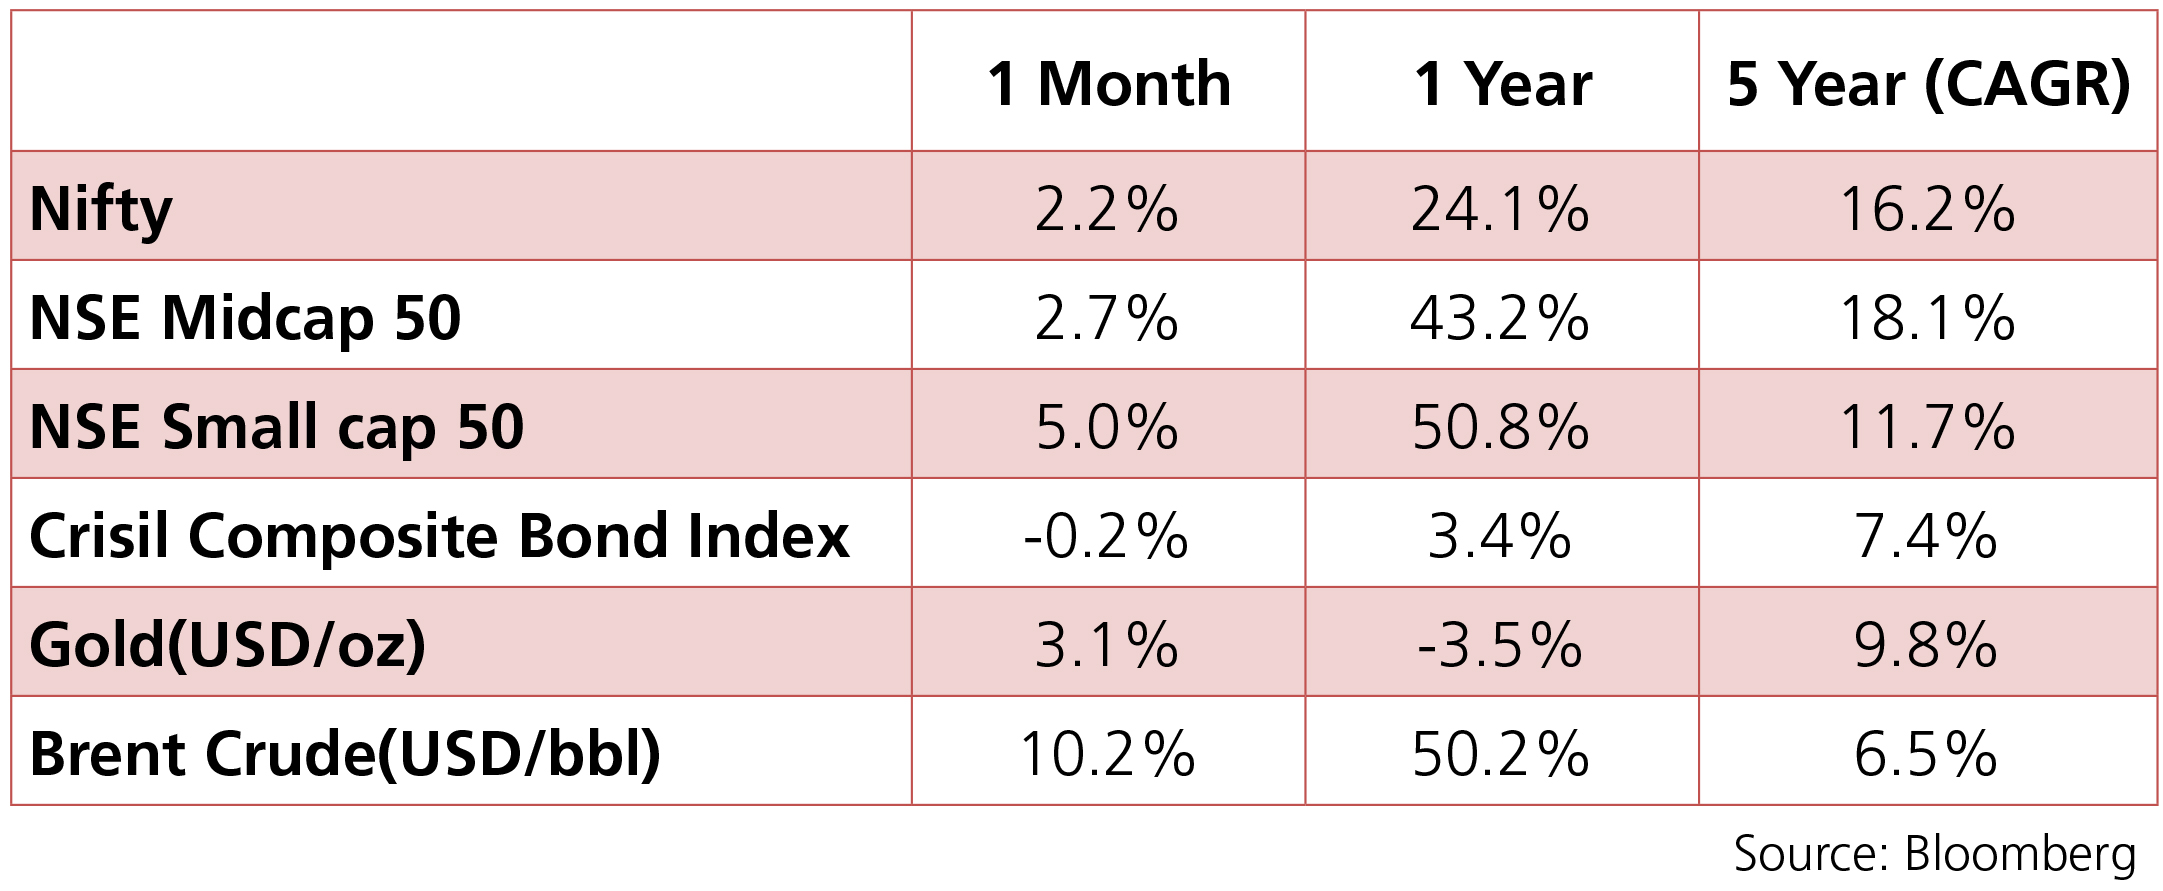
Markets moved up but only slightly as surging cases of omicron, rising inflation, and a hawkish tone by
the global central banks weighed heavily on sentiments. The Nifty index closed 2.2% higher for the month
of December. IT and Materials have been the frontrunner sectors while Telecom and Energy have been the
laggards. The INR witnessed a bit of volatility over the month as ineterst rate policies began to turn averaging
around 75.4 with a monthly best and worst of 74.3 and 76.2 respectvely. Yields continued on an upward
trajectory with the 10y benchmark trading in a range of 6.35%-6.48% and eventually ending the month
12bps higher m-o-m at 6.45%. The 10y benchmark averaged 6.41% over the month of December.
One of the major events for the month of December was the FOMC meeting. As expected, the FOMC doubled the monthly pace of asset purchase tapering to USD 30bn, putting purchases on track to be concluded by March. The median forecast “dot” plot now signals that the FOMC plans to hike three times next year, three times in 2023 and two times in 2024 with terminal rate expected to be 2.00-2.25% in 2024. The Bank of England became the first major central bank to raise plocy rates as it increased policy rate by 15bps to 0.25% basing its decision on a strong labour market and surging inflation while seeing through the risk of Omicron. On the other hand, the European Central Bank (ECB) detailed a very gradual tapering of QE over the next three years, with the Pandemic Emergency Purchase Programme (PEPP) ending in March 2022, but the Asset Purchase Programme (APP) continuing. The ECB has stated that net QE purchases will end shortly before it starts raising key interest rates. ECB President Lagarde confirmed that it was “very unlikely” that the ECB will raise rates in 2022 with current high inflation still deemed “transitory”.
On the domestic front, the RBI stayed put on policy rates while continuing to focus on liquidity tightening. The MPC maintained its guidance of a continued accommodative stance as long as necessary to revive and sustain growth on a durable basis while ensuring that inflation remains within the target going forward. Governor Das stated that the RBI seeks to rebalance the liquidity surplus by shifting it from the fixed rate reverse repo window to the variable rate reverse repo (VRRR) with the 14-day VRRR auction as the main liquidity management tool. The RBI maintained its FY22 GDP growth projection of 9.5% y-o-y and its FY22 CPI inflation forecast at 5.3%.
In commodities, brent crude averaged USD 74.3/bbl over the month. However, a pickup in prices post the sharp dip at the close of last month saw Brent crude up 11% on a m-o-m basis. Gold edged higher by 3.1% over the month as risk-off sentiments resurfaced.
 Source: Bloomberg
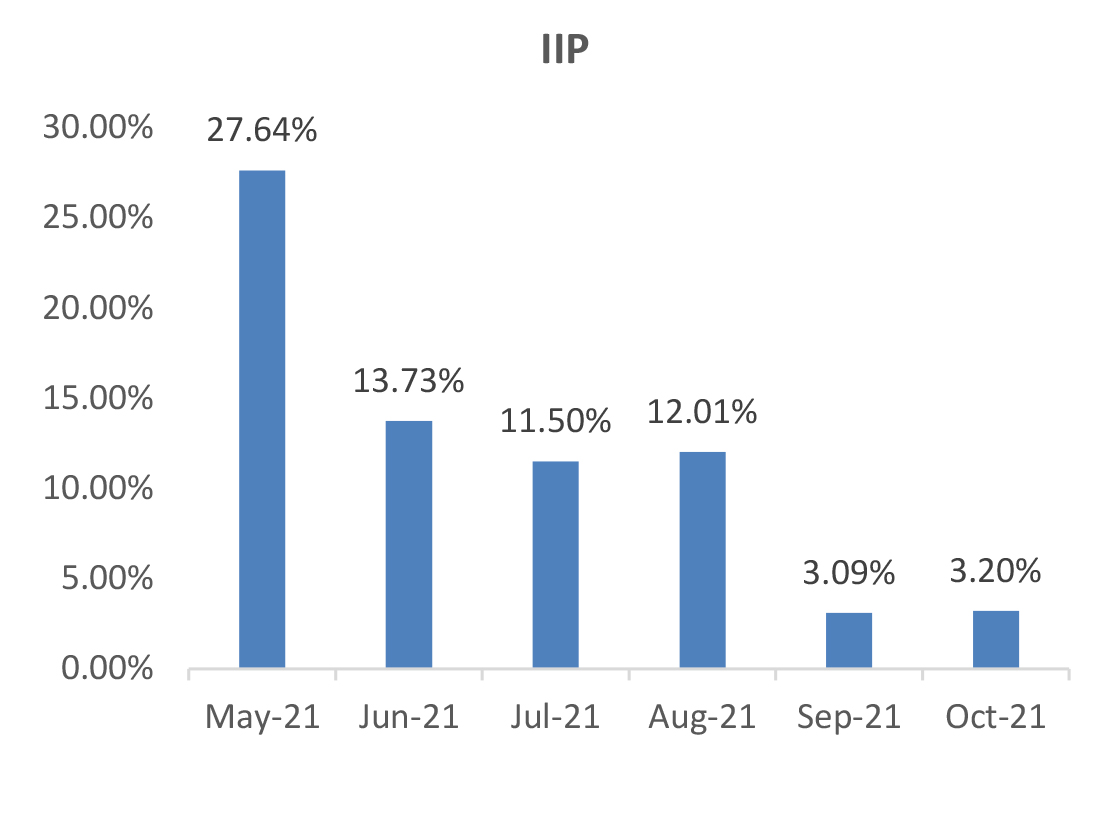
IIP: October IIP registered a growth of 3.2% (September: 3.1%) led largely by a pick-up in sequential
momentum (4.5% m-o-m) on the back of the festive season demand. On a sectoral basis, mining picked up by
11.4% (September: 8.6%), electricity production by 3.1% (0.9%), and manufacturing activity by 2% (2.7%).
Compared to October 2019, IIP was 8% higher and witnessed growth across the board (manufacturing was
higher by 7%, mining by 10%, and electricity production by 15%). As per the use-based classification, capital
goods and consumer durable production contracted by 1.1% (September: +2.4%) and 6.1% (September:
(-)1.9%) respectively. Meanwhile, production of primary, intermediate goods, consumer non-durables and
infrastructure/ construction maintained a positive momentum.
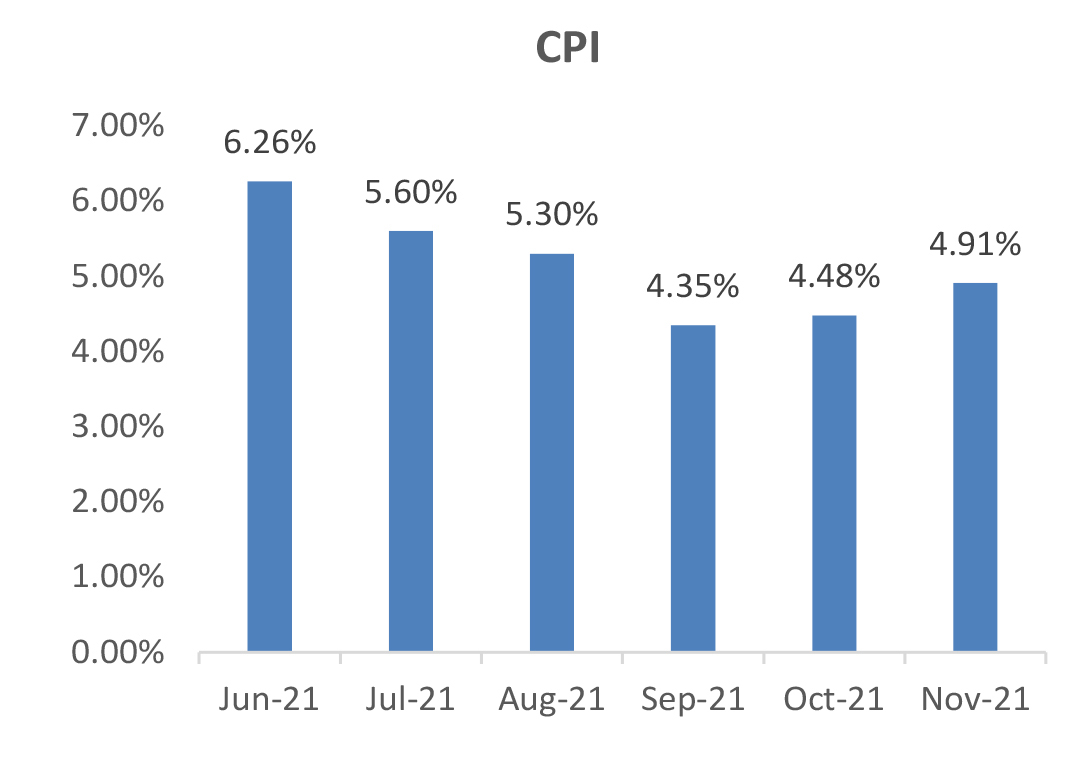
CPI: November CPI inflation came in softer than expectations at 4.91% (October: 4.48%) on the back of lowerthan- expected sequential pickup in food prices. Food inflation increased to 1.9% (October: 0.8%) primarily led by sequential rise in prices of vegetables, fruits, and eggs, while prices of meat and fish and oil and fats declined and pulses remained muted. Core inflation (CPI excluding food, fuel, pan and tobacco) at 6.3%, rose by 30 bps from October while increasing sequentially by 0.4% (0.7% m-o-m in October). Prices increased across all categories led by transport, clothing and footwear, and recreation. On a sequential basis, the prices of transport and communication declined by 0.6% m-o-m, reflecting the partial impact of excise duty cuts on petroleum prices.
Trade Deficit: December trade deficit at USD 22bn was only marginally lower than the record highs of September and November. Export growth has been robust, rising 37% from 27.2% in November, with a strong sequential uptick (24.1% m-o-m). In 9MFY22, exports at USD 301.3bn increased by 50% over 9MFY21 and by 26% over 9MFY20. Imports also remained strong, rising 38.1% in December, a moderation from 56.6% in November, mainly reflecting adverse base effect. In 9MFY22, imports at USD 441.5bn increased by 70% over 9MFY21 and by 21.2% over 9MFY20. Trade deficit for 9MFY22 was at USD 140.2bn (USD 59.1bn in 9MFY21 and USD 125.9bn in 9MFY20).
CAD and BoP: The current account registered a deficit of USD 9.6bn (1.3% of GDP) in Q2FY22 against a surplus of USD 6.5bn in Q1FY22 (0.9% of GDP). The deficit was led by a widening of the trade deficit to USD 44.4bn (Q1FY22: USD 30.7bn) and an increase in net investment income outflow of USD 10bn (USD 7bn in Q1FY22). Exports were at USD 105bn (USD 97.4bn in Q1FY22) but imports increased to USD 149.3bn (USD 128.2bn in Q1FY22). Non-oil imports rose to USD 110bn reflecting increased domestic demand following the easing of restrictions in the second Covid wave. Meanwhile, capital account balance increased to USD 40bn (USD 25.5bn in Q1FY22) led by USD 17.9bn of SDR allocation from IMF. FPI flows increased to USD 4bn on account of debt flows (USD 0.4bn in Q1FY22) while FDI inflows moderated to USD 9bn (USD 12bn in Q1FY22). BOP surplus in Q2FY22 was at USD 31.2bn (USD 31.9bn in Q1FY22) which would have been USD 13.3bn without IMF’s SDR allocation.
Fiscal Deficit: The fiscal deficit stood at 46.2% of the Budget Estimates, as compared to 135.1% in the same period last year. In absolute terms, the fiscal deficit was at Rs 6,95,614 crore at the end of November. The main contributors to the lower fiscal deficit were higher net tax revenues at 73.5% of BE vs 42.1% in the corresponding period previous year and non-tax revenues at 91.8% vs 32.3% in the same period last year. At the same time, total expenditure was marginally lower at 59.6% for the period vs 62.7% in the same period last year.
Deal flow remained steady in December with 18 deals worth ~USD 2.2bn executed (vs 13 deals worth ~USD
4.9bn in November). Key deals included IPOs of Star Health (~USD 0.8bn), Medplus (USD 0.2bn), Metro (USD
0.2bn) and Rategain Travel (USD 0.2bn).
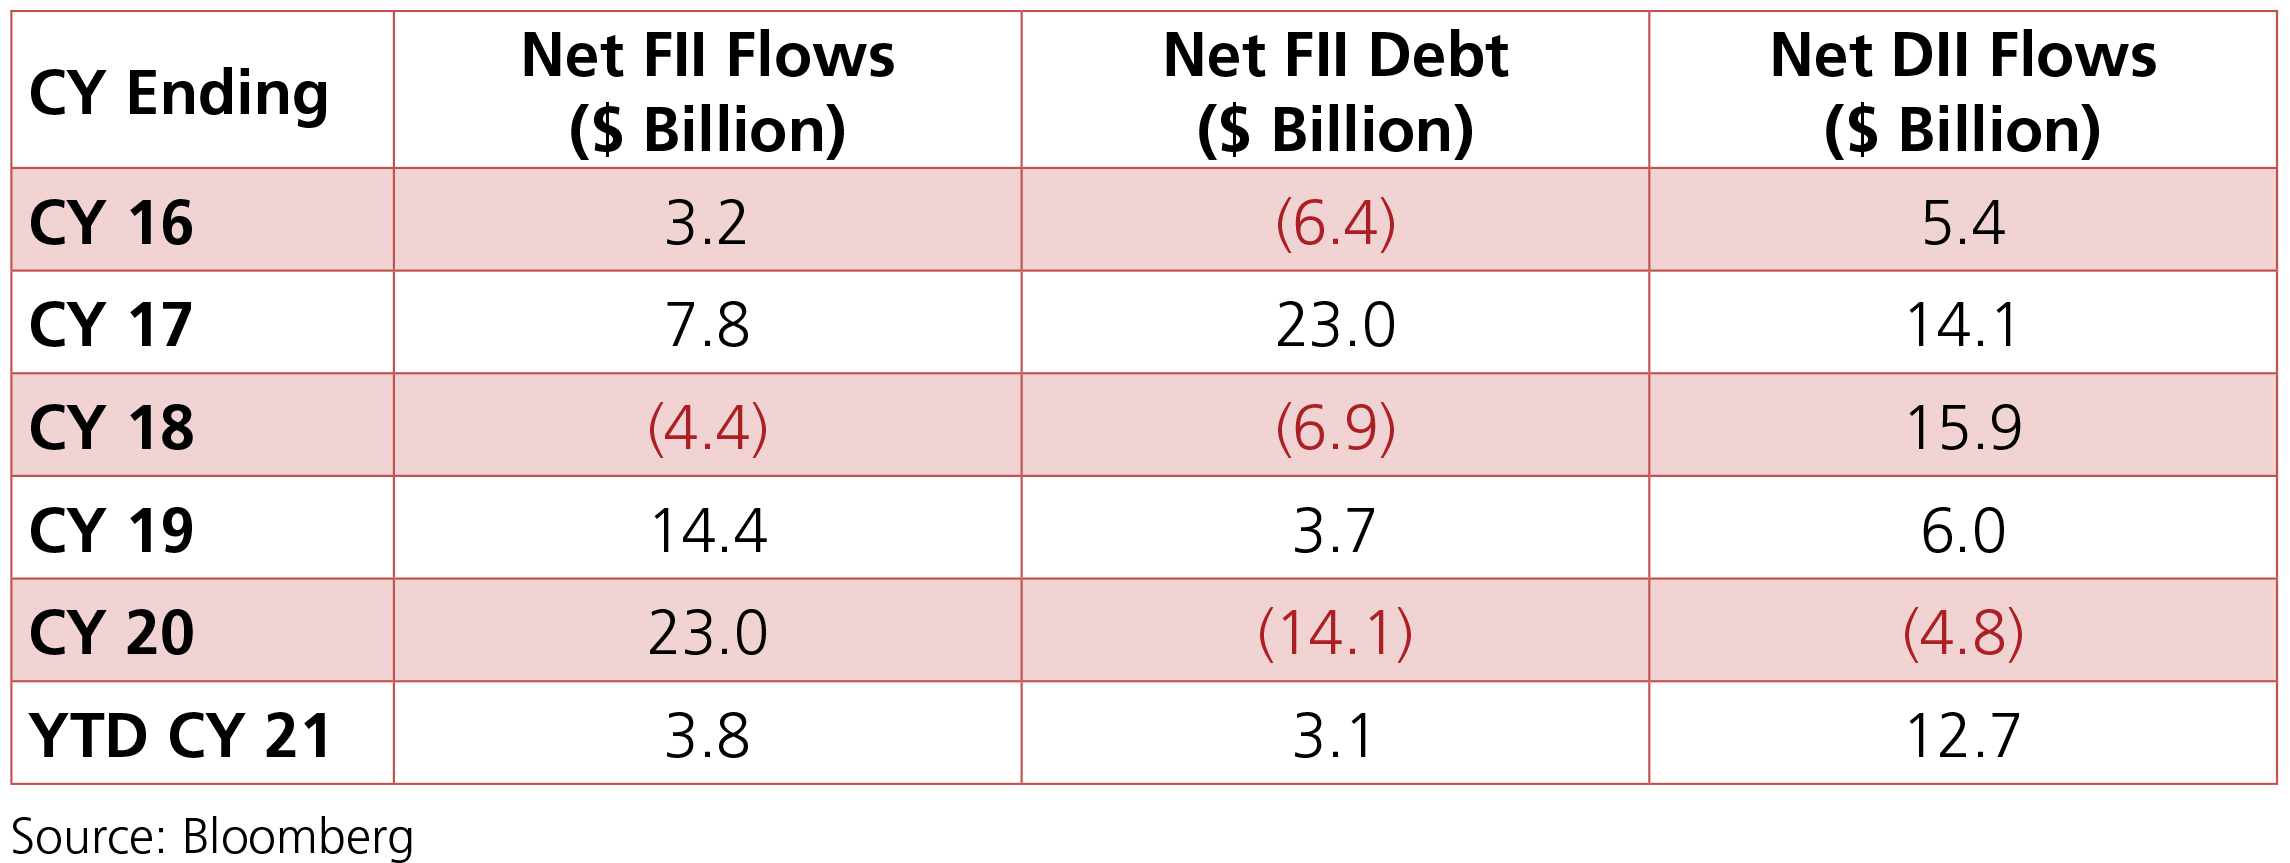
FIIs recorded the longest selling streak in last 10Y (26 days) with them being net sellers to the tune of –USD 1.7bn in Dec (YTD +USD 3.8bn) even as DII buying continued +USD 4.3bn (YTD +USD 12.7bn), driven by both MFs (USD 2.5bn) and Insurance (+USD 1.2bn)
FIIs recorded the longest selling streak in last 10Y (26 days) with them being net sellers to the tune of –USD 1.7bn in Dec (YTD +USD 3.8bn) even as DII buying continued +USD 4.3bn (YTD +USD 12.7bn), driven by both MFs (USD 2.5bn) and Insurance (+USD 1.2bn)
