Market Outlook
|
AS ON 30th October 2020
|
Month Gone By – Markets (period ended October 30, 2020)
The Indian equities staying true to expectations, were immensely volatile during the month of October –
opening at 11,364 on October 1st to first ever breaching 12,000 levels on October 12th since the March
meltdown, before finally closing at 11,642 on October 30th. What really contributed to this volatility was
the stimulus tantrum in USA majorly during the first half of the month followed by a risk-off sentiment
due to the second wave of infections in Europe. The risk-off sentiment is expected to continue well into
the US Presidential Elections. The crude has recorded almost a 10% fall from monthly highs of $43
owing to risk-off sentiment, but there are significant upside factors emerging to push crude prices higher
–a staggering recovery in major economies and seasonal spikes during winter months.
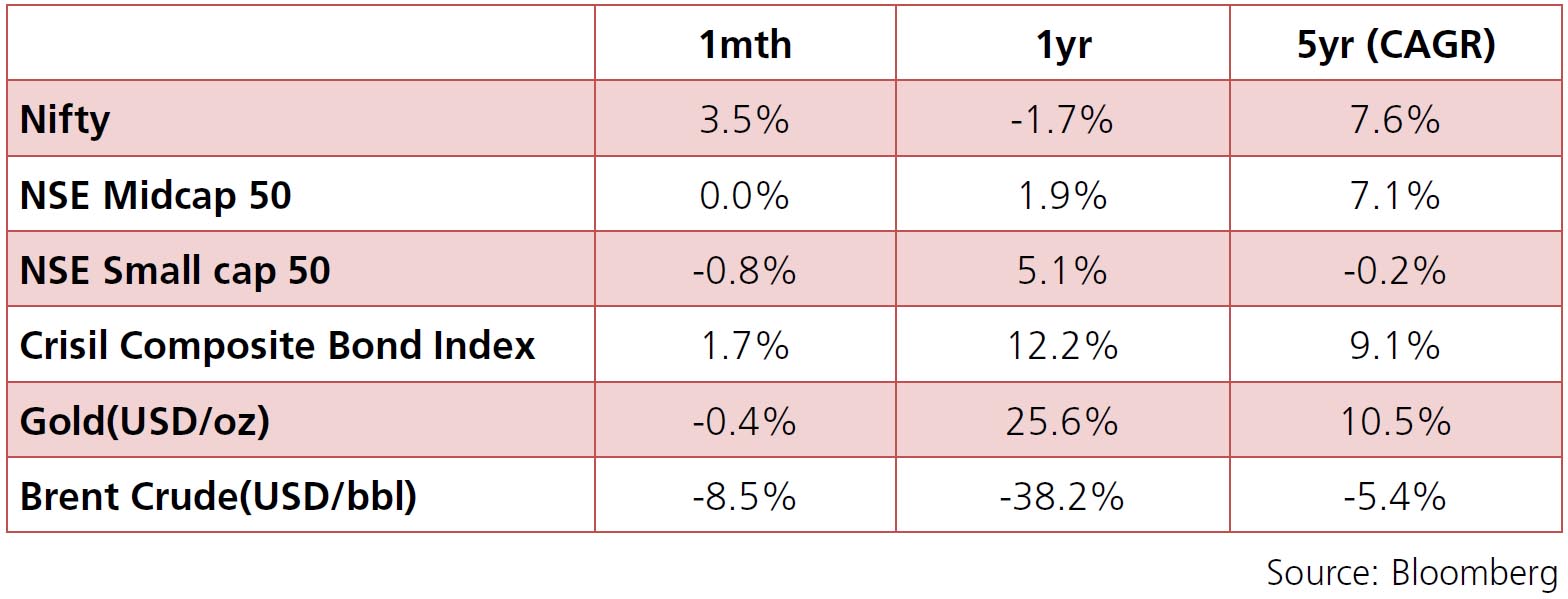
INR saw a gradual weakening in the month. From recording a close of 73.14 on October 1st, it weakened to 74.55 on October 31st. Though the economic severity of lockdowns imposed in Europe remain largely debated, the risk-off sentiment triggered ahead of major events, no major inflows to boost rupee and second wave of pandemic requires a further weakening bias towards INR.
INR saw a gradual weakening in the month. From recording a close of 73.14 on October 1st, it weakened to 74.55 on October 31st. Though the economic severity of lockdowns imposed in Europe remain largely debated, the risk-off sentiment triggered ahead of major events, no major inflows to boost rupee and second wave of pandemic requires a further weakening bias towards INR.

IIP: Index for Industrial Production for August contracted 8% (vs. 10.4% contraction in July). Manufacturing
which has a weight of 77.63% in the index recorded a fall of 8.6%, followed by mining (weight of 14.38%)
recording a fall of 9.8%. In the manufacturing, biggest contributors to the fall were coke, refined petroleum
products, textiles and wearing apparel, vehicles and capital equipments.
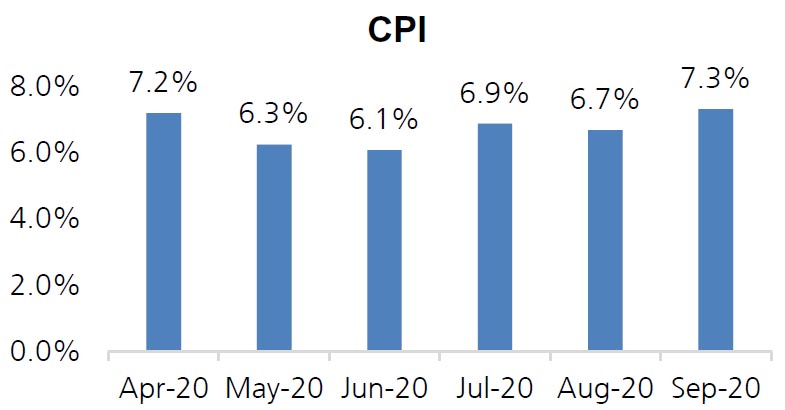
CPI: Headline CPI for September came in at 7.34% vs expectations of 6.9%.. Food inflation recorded a spike of 9.73% bolstered by vegetables which rose by 20.7% y-o-y and protein basket which has a combined weight of 13% in the index recorded a spike of 11% y-o-y. Transport and Communication which has a weight of 7.6% also recorded a spike of 11.5% y-o-y.
Trade Deficit : India recorded a trade deficit of USD 2.7 bn vs USD 11.7 bn recorded last year. Exports at USD 27.58 bn were 6% above last year corresponding month’s figure of USD 26.02 bn, while imports in September 2020 were USD 30.31 bn, which is a decline of 19.60% over imports of USD 37.69 bn in September 2019. Oil imports in September 2020 were USD 5.83 bn, which is 35.88% lower compared to USD 9.09 bn in September 2019. However taking trade and services together, the overall trade balance is a surplus of USD 4.13 bn.
Fiscal Deficit: : India’s fiscal deficit stood at Rs 9.14 tn at the end of September, at 115% of the budgeted target for the current fiscal year vs 93% last fiscal year. This can be attributed to fall in total receipts to 27% of the budgeted revenue vs 42% last fiscal, while total expenditure was at 48.6% of budgeted target as compared to 53.4% corresponding periodlast year. The government’s gross tax revenue dropped 21.5% year-on-year to Rs 7.21 tn in April-September. The net tax revenue collected during the period was Rs 4.58 tn, about 28% of the budget target of Rs 16.35 tn, and a drop of over 24% year-on-year.
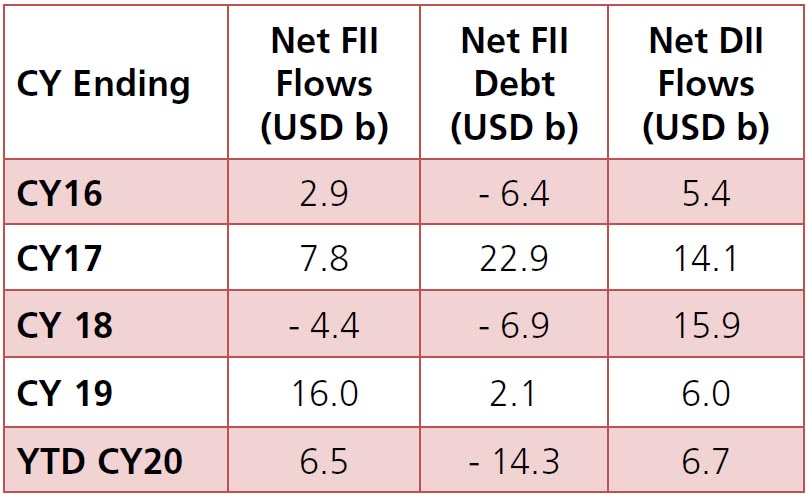
In flow trends, FIIs were net buyers in October of
~$2.5bn (vs net sellers of ~$0.8bn in September)
taking their YTD inflows to ~$6.5bn. DIIs were net
sellers of ~$2.4bn in October taking down their YTD
inflows to ~$6.7bn. Both Domestic MFs (~$1.6bn,
YTD +$0.8bn) and other DII (~$0.7bn, YTD +$5.8bn)
were net sellers in October.
