Market Outlook
|
AS ON 31st March 2022
|
Month Gone By – Markets (period ended March 31, 2022)
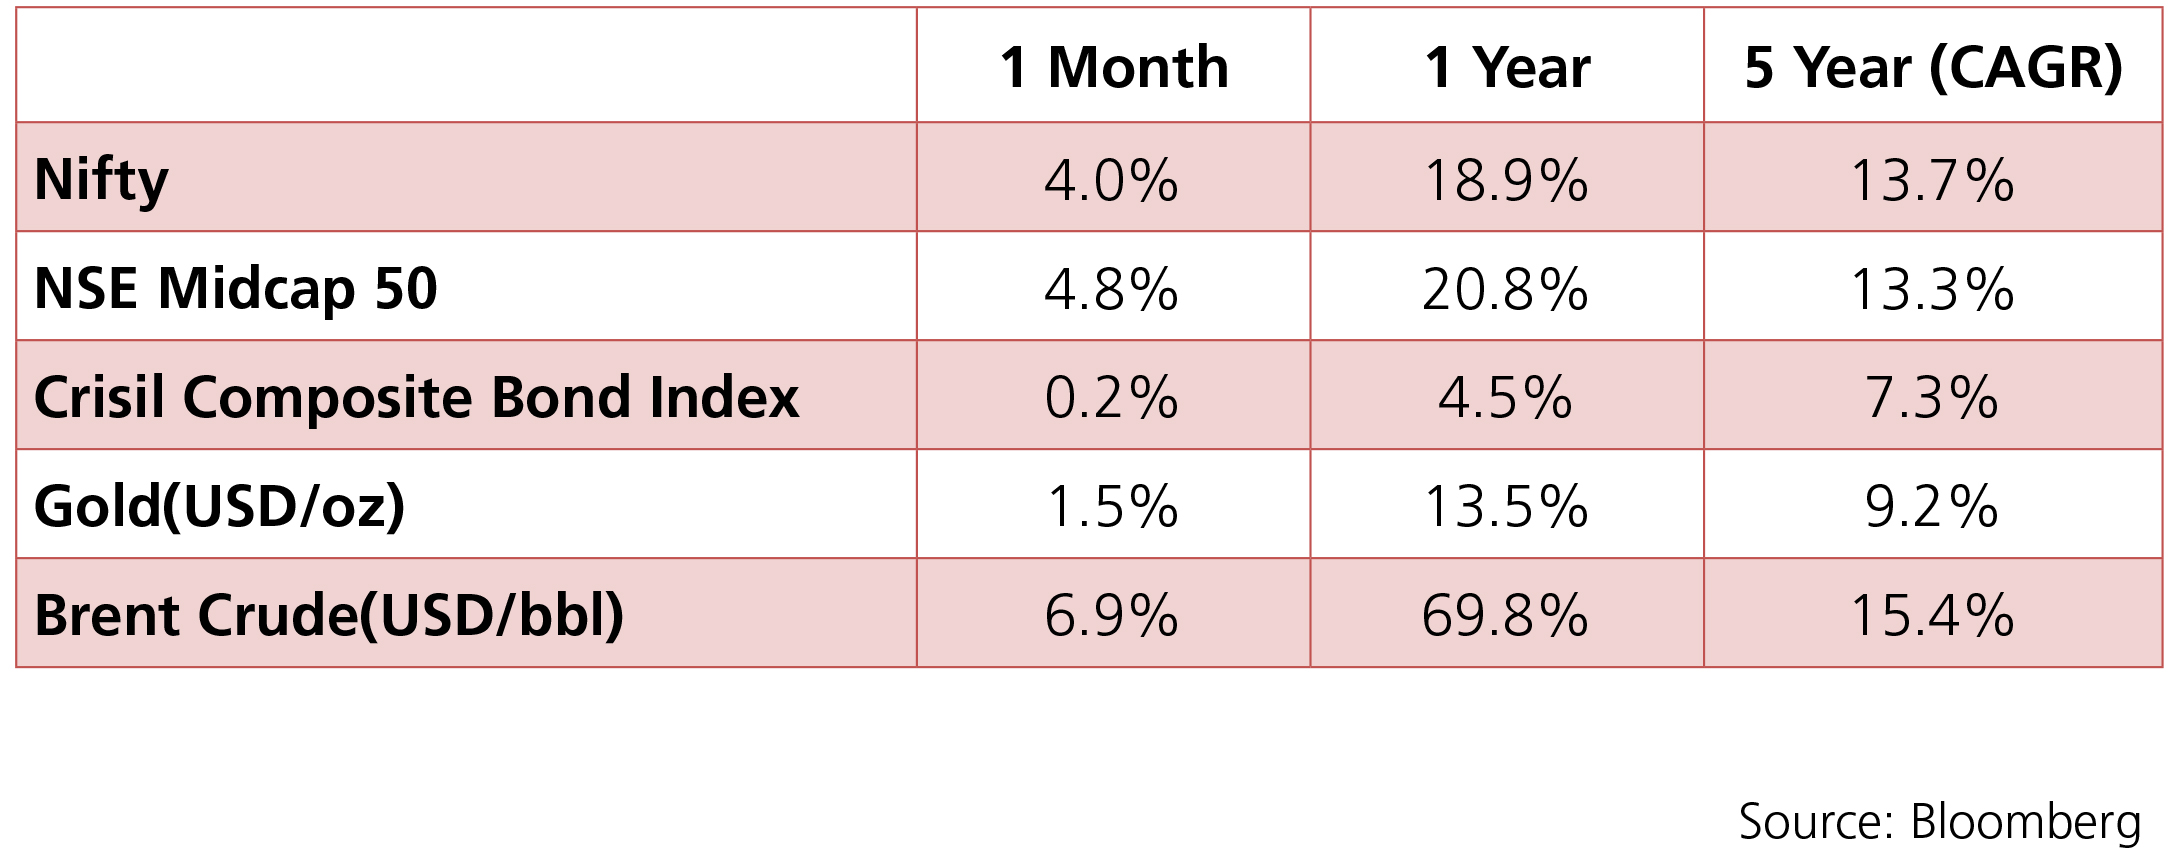
Markets moved up 4% with domestic sentiment remaining buoyant after the ruling party BJP won 4
out of 5 state elections and economic activity returning to pre-COVID normalcy in most cases. Telecom
and Energy sector have been the frontrunner sectors while Auto and Infra have been the laggards.
The INR has been quite volatile tracking crude prices as it averaged around 76.23 with a monthly best
and worst of 75.56 and 77.09 respectively. Yields continued on an upward trajectory with the 10y
benchmark trading in a range of 6.77%-6.90% and eventually ending the month 7bps higher m-o-m
at 6.84%. The 10y benchmark averaged 6.82% over the month of March.
One of the major events for the month of March was the FOMC meeting. As expected, the FOMC raised the target range for the federal funds rate by 25 basis points (bps) amid rising inflation and a strong labour market, to a range of 0.25% to 0.50%. The Bank of England’s Monetary Policy Committee (MPC) too raised interest rates for the third meeting in a row, from 0.5% to 0.75%. This was in response to rising inflation, expected to hit 8% in April (driven higher by the Ukraine conflict), well above the MPC’s 2% target. On the other hand, the European Central Bank (ECB) revised the purchase schedule for its Asset Purchase Programme (APP). Monthly net purchases under the APP will amount to EUR 40 billion in April, EUR 30 billion in May and EUR 20 billion in June. The calibration of net purchases for the third quarter will be data-dependent and reflect its evolving assessment of the outlook.
On the domestic front, as the financial year drew to a close, market participants started to contemplate various scenarios regarding the Govt. Securities (G-Sec) borrowing calendar as to the possible split between the first-half and second half as well the mix over the tenors. The borrowing calendar is the most important event ahead of the RBI MPC meeting next month and is likely to have significant bearing on the shaping of the yield curve. The RBI also announced USD/INR sell-buy swaps for USD5 bn towards the end of the month – a tool that is used by the RBI to provide support to the INR as well as manage system liquidity.
Brent crude touched a high of USD 133.9/bbl as the war between Russia and Ukraine continued with no signs of a permanent ceasefire. Geopolitical risks remain the most significant variable driving crude prices at this point. Gold too edged higher by 1.5% over the month as risk-off sentiments linger on although not as dominant as at the start of the conflict.
 Source: Bloomberg
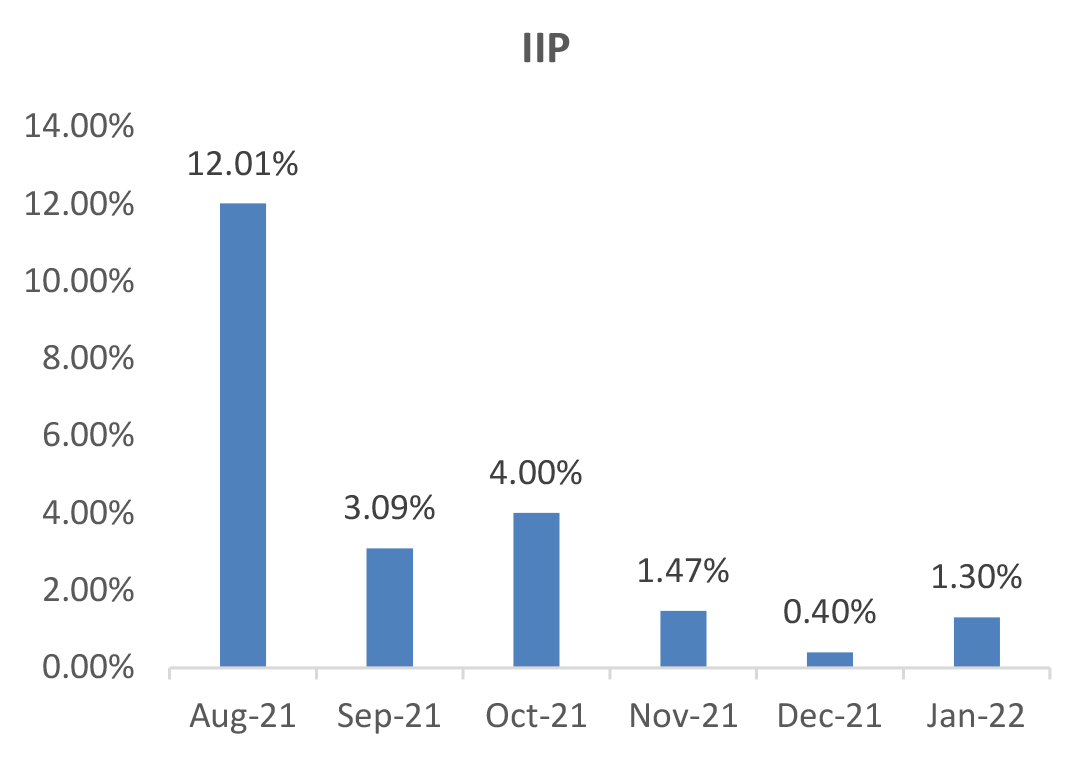
IIP: January IIP registered a growth of 1.3% yoy (December: 0.7%) with the aid of marginal positive
base effects. On a sectoral basis, all components exhibited positive growth led by mining activity
growing by 2.8% (December: 2.6%), manufacturing by 1.1% (0.2%), and electricity production by
0.9% (2.8%). Compared to January 2020, IIP was 0.7% higher and witnessed growth in all three
segments. As per the use-based classification, production of consumer durables, and capital goods
contracted over January 2021 by 3.3% and 1.4%, respectively. When compared to January 2020,
primary goods, intermediate goods and infrastructure and construction goods registered positive
growths while capital goods consumer durables and non-durables declined.
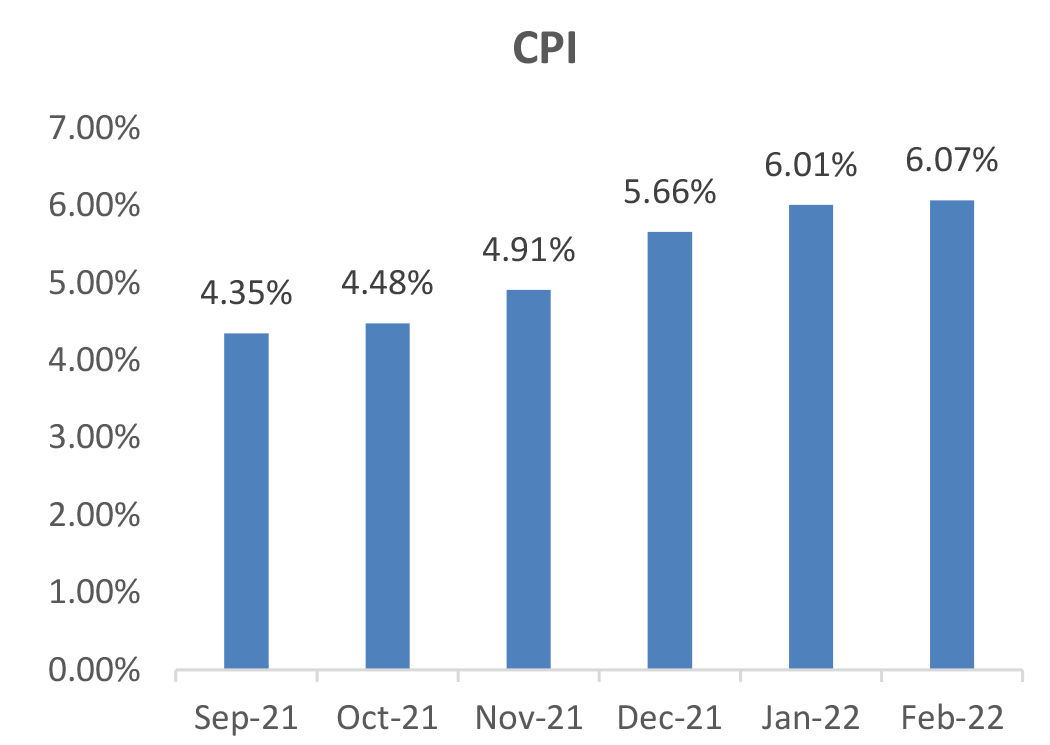
CPI: February CPI inflation rose to 6.07% (January: 6.01%), increasing sequentially by 0.2%. Food inflation increased to 5.9% yoy (January: 5.4%), and, on a sequential basis, prices of meat and fish rose the most by 1%. Fuel and light inflation moderated further to 8.7% (January: 9.3%). Urban inflation moderated marginally to 5.8% (January: 5.9%), while rural inflation rose to 6.4% (January: 6.1%). Core inflation (CPI excluding food, fuel, pan and tobacco) moderated by 15 bps to 6.05% but increased 0.5% mom (0.4% mom in January). The sequential increase in core inflation continued to be broad-based with prices increasing across all categories, led by footwear, personal care and effects, and recreation and amusement.
Trade Deficit: India’s merchandise exports at USD 34.6bn in February 2022 remained above USD 30bn mark, registering a growth of 25.1% and over pre-Covid levels (24.6%). Growth was broad-based, with ten major commodity groups accounting for around 80% of exports of the expansion above pre-COVID level. The improvement in export performance stemmed from higher value of shipments of engineering goods, petroleum products and chemicals. Merchandise imports at USD 55.4bn in February 2022 remained above USD 50bn for the sixth consecutive month, registering a growth of 46.3% over pre-pandemic levels. Robust import demand was driven by higher demand for petroleum products, electronic goods and gold. Import growth was broad-based, with major commodity groups accounting for more than 75% of imports recording an expansion above their pre-COVID levels. As imports grew faster than exports, India’s trade deficit (at USD 20.9bn) in February 2022 increased, both sequentially (USD 17.9bn in January 2022) as well as on a y-o-y basis (USD 13.1bn in February 2021) and pre-Covid levels (USD 10.2bn in February 2020).
CAD and BoP: The current account registered a deficit of USD 23bn (2.7% of GDP) in 3QFY22, widening from a deficit of USD 9.9bn in 2QFY22 (1.3% of GDP) and a deficit of USD 2.2bn in 3QFY21 (0.3% of GDP). This was mainly due to a widening of the trade deficit to USD 60.4bn (2QFY22: USD 44.5bn). Exports improved marginally to USD 109bn (USD 105bn in 2QFY22), while imports surged to USD 169bn (USD 149bn in 2QFY22). Even as oil imports picked up to USD 44bn (from USD 39bn in 2QFY22), non-oil imports rose sharply to USD 126bn (from USD 110bn in 2QFY22). Meanwhile, the capital account balance moderated to USD 23bn (2.8% of GDP, USD 40bn in 2QFY22) mainly due to FPI outflows of USD 5.8bn (+USD 3.9bn in 2QFY22), lower FDI inflows (USD 5.1bn compared to USD 9.6bn in 2QFY22) and ECBs flows ((-)USD 0.1bn in 3QFY22 from +USD 4.1bn in 2QFY22). Overall, BOP surplus in 3QFY22 moderated to USD 0.5bn (USD 31.2bn in 2QFY22 and USD 32.5bn in 3QFY21).
Fiscal deficit: The fiscal deficit stood at 82.7% of the Revised Estimates, as compared to 76% in the same period last year. In absolute terms, the fiscal deficit was at Rs 13,16,595 crore at the end of February. The main contributors to the lower fiscal deficit were strong net tax revenues at 83.9 RE and non-tax revenues 98.8%. Meanwhile, total expenditure was marginally lower at 83.4% for the period vs 81.7% in the same period last year.
Deal flow was slow in March with 12 deals worth ~USD 729mn executed. Key deals included Achyut
Healthcare (~USD 469mn) and Indian Hotels Co Ltd (~USD 262mn)
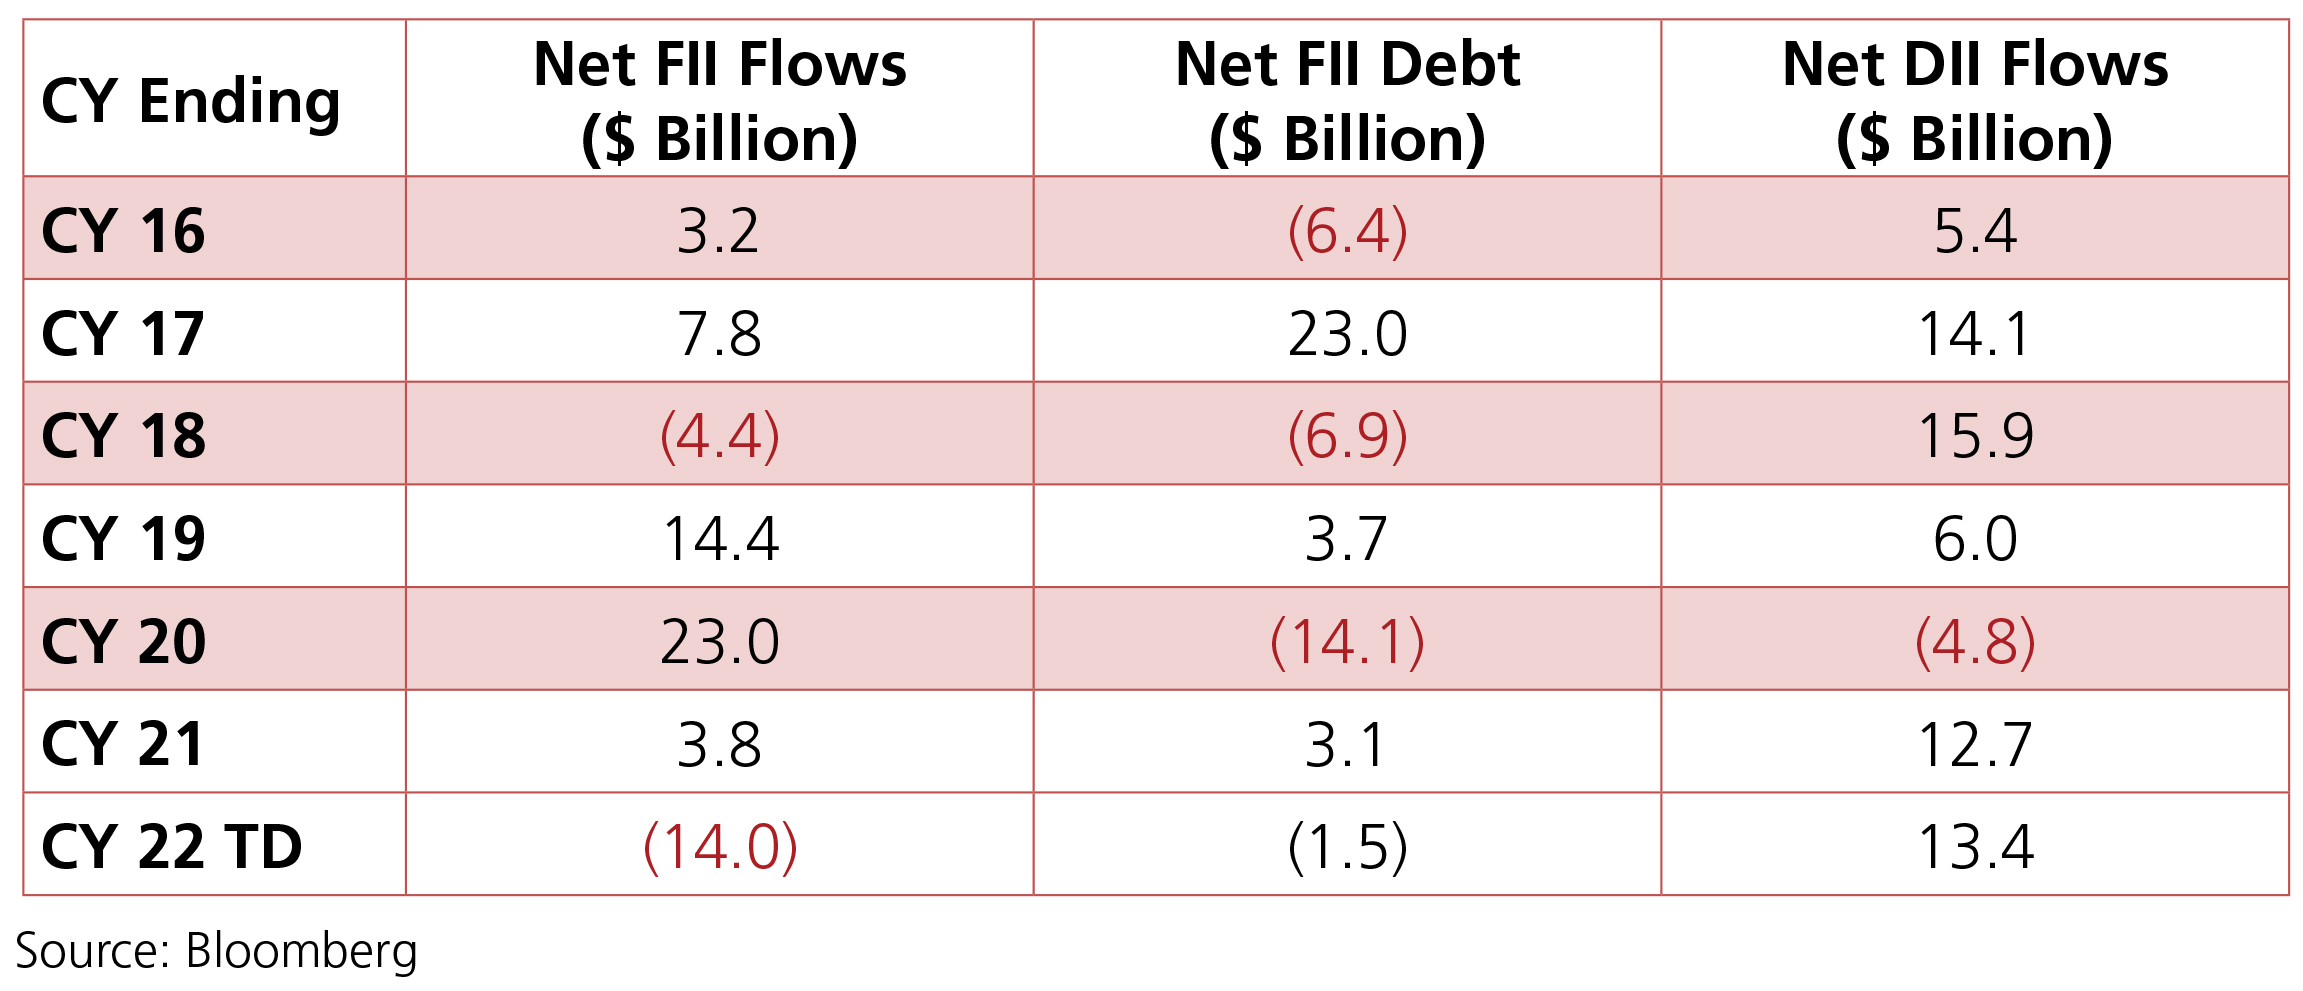
FIIs continued being net sellers in the month of March 2022 and were net sellers to the tune of –USD 4.4bn even as DII buying continued +USD 5.1bn. MFs had put in +USD 3.1bn till 29th March 2022.
FIIs continued being net sellers in the month of March 2022 and were net sellers to the tune of –USD 4.4bn even as DII buying continued +USD 5.1bn. MFs had put in +USD 3.1bn till 29th March 2022.
