Market was up 2.0%, primarily driven by strong domestic institutional flows and favorable macros.
But it was down 2.7% from its mid-September peak. Industrials, IT and Discretionary have been
the frontrunner sectors. The INR saw slight depreciation against USD and averaged 83.08, with
a monthly best and worst of 82.7 and 83.3, respectively, in September. 10yr benchmark yields
traded in the range of 7.13%-7.25% and eventually ended the month 5bps higher sequentially at
7.22%. The 10y benchmark averaged 7.19% in September.
Global central banks continue to maintain a hawkish tone as inflation remains elevated, but they are also deciding on the peak rates and duration of holding rates high to tame down inflation to their target. The Fed opted for maintaining the status quo on rates as widely expected after a cumulative 525bps rate hike seen over the past year. However, fed rate projections indicated another 25bps rate hike in 2023 with higher growth projections. The recent surge in oil prices has led to an acceleration in the US inflation rate to 3.7% in August. The US economy added a much softer 105k/157k/187k jobs in June/July/August 2023, compared to the above 200k jobs added per month prior to May 2023. Inflation in the EU continued to ease, at 4.3% in September. However, the ECB delivered another 25bps rate hike and mentioned that the committee is shifting its focus to ‘how long to keep rates at a restrictive level’. Bank of England, Bank of Canada, and Reserve Bank of Australia chose to maintain the status quo on interest rates in their recent meetings.
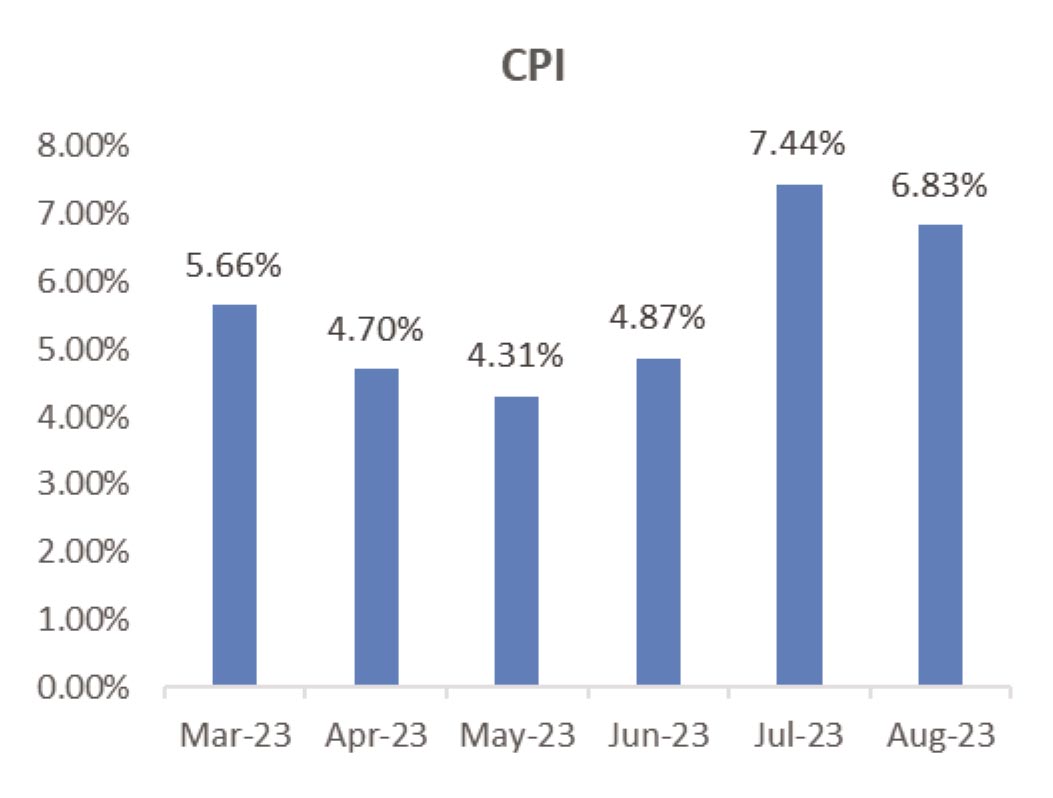
Inflation in India softened to 6.8% but stayed elevated in August due to a correction in vegetable prices from the 15-month high of 7.4% seen in July. Sequentially, food prices corrected by 52bps easing headline CPI by 5bps. On the bright side, core CPI relieved for the second month to 4.9% yoy. The RBI had already commented that the current vegetable price led inflationary pressure is transitory. The southwest monsoon withdrew with 6% below normal rainfall, while relief comes from kharif sowing, which achieved similar acreage as the previous year. Other high frequency indicators suggested robust macroeconomic activity. Recent prints of IIP, credit growth, and GST collections all pointed to strength in Indian macros. Core sectors displayed strength, with the cement and electricity sectors registering double-digit growth. On the fiscal front, tax revenue rebounded in August and gave ample support to tame the fiscal deficit. Government capex has also been healthy, with productive sectors like railways and roads witnessing good traction. Central government also stuck to its borrowing plan by not altering the scheduled borrowing program for the second half of FY24 (Rs 6.55tn). India also hosted the 18th G20 leaders meeting in the month where the New Delhi declaration was adopted with 100% consensus, which is considered a win for India’s diplomacy and rising stature.
Brent crude prices surged to an average of USD93/bbl in September from USD85/bbl in August, as they ranged between USD89-USD97/bbl. Supply cuts by major producers and the OPEC outlook report on strong demand exerted upward pressure on oil prices. The gold price saw a dip as it ended at USD 1,848/oz in September from USD 1,947/oz in August. Steel price trended lower as HRC prices ended the month at USD704/Tn compared to USD729/Tn in August.


CPI: August CPI inflation at 6.83% moderated, mainly due to a fall in prices of perishables—in line
with expectations. Core CPI inflation was comfortable at sub-5% levels. However, upside risks
remain from weather-related uncertainties and rising crude oil prices. We estimate the FY2024
CPI inflation at 5.5% (5.6% earlier). Furthermore, we expect the RBI to manage risks to inflation
and INR through liquidity tightening measures, while maintaining a pause on the repo rate.
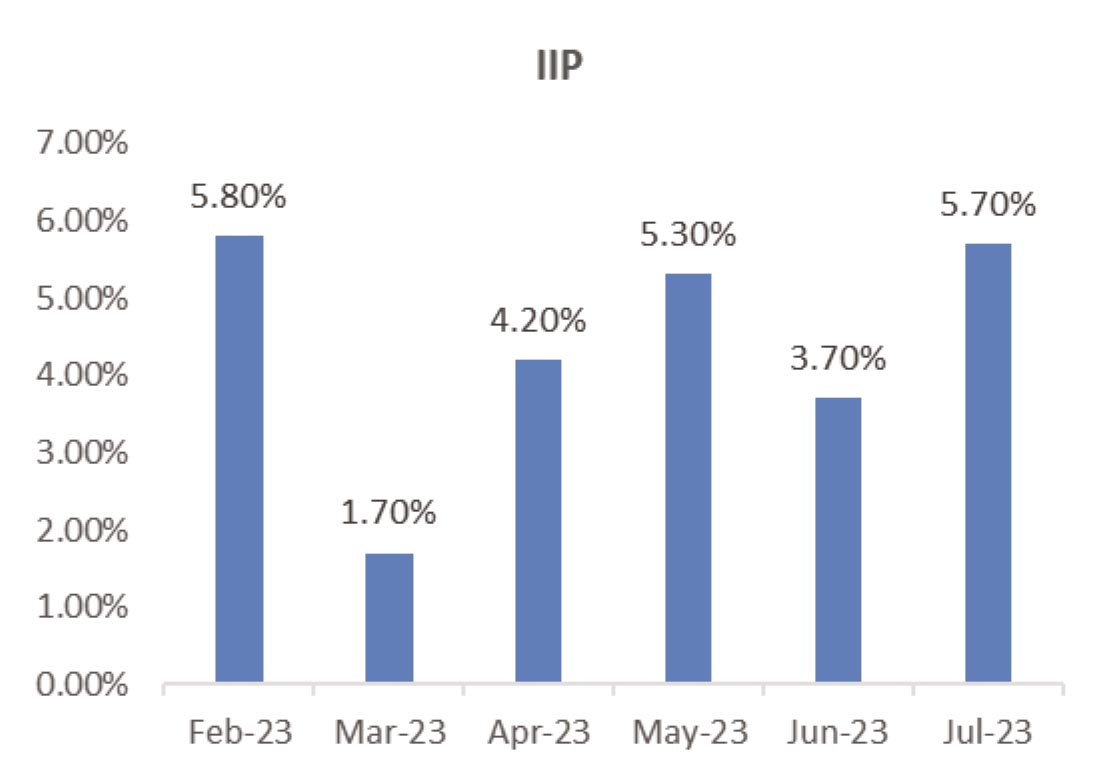
IIP: July IIP growth surprised on the upside 5.7% (June: 3.8%) aided by a favorable base effect with IIP contracting 1% sequentially (June: 1.1% mom). As per the sectoral classification, manufacturing sector growth was at 4.6% (June: 3.1%), mining activity growth was at 10.7% (7.6%), and electricity production growth was at 8% (4.2%). As per the use-based classification, all categories registered positive growth except for the consumer durables segment which contracted by 2.7% (June: (-)6.7%).
Trade: Exports in August fell by 6.9% yoy to US$34.5 bn (July: US$32.3 bn) led by oil exports increasing to US$5.9 bn (US$4.6 bn). Non-oil exports increased to US$28.6 bn (July: US$27.7 bn). Imports in August fell by 5.2% yoy to US$58.6 bn (July: US$52.9 bn). Non-oil imports increased to US$45.4 bn (from US$41.2 bn in July) led by gold, iron and steel, and transport equipment. The goods trade deficit widened to US$24.2 bn (July: US$20.7 bn). Services trade surplus in August remained firm at US$12.5 bn (July: US$12.5 bn) with exports at US$26.4 bn and imports at US$13.9 bn.
Monsoon: Till September 29, cumulative rainfall was 6% below long-term average while weekly rainfall was 6% above long-term average. On a cumulative basis, rainfall was normal in north west, central India, and southern India, while it was relatively weaker in east and north east India. Out of the 36 sub-divisions, till date, seven have received deficient rainfall, 26 have received normal rainfall, and three have received excess rainfall.
CAD and BoP: CAD in 1QFY24 widened to US$9.2 bn (4QFY23: US$1.4 bn) led by widening of nonoil goods trade deficit to US$32 bn (4QFY23: US$26 bn). Net invisible inflows fell to US$47 bn (4QFY23: US$51 bn) amid a moderation in services surplus. Capital account surplus in 1QFY24 surged to US$34 bn (4QFY23: US$7 bn) aided by FPI net inflows of US$16 bn and banking capital flows of US$13 bn whereas FDI inflows remained tepid at US$5 bn. BOP surplus in 1QFY24 increased to US$24.4 bn (4QFY23: US$5.6 bn) while FX reserves increased by US$16.6 bn including a valuation effect of (-)US$7.8 bn given US Dollar appreciation.

Deal flow saw a slowdown in September with reported 31 block deals worth ~$1.5bn executed.
Key deals included Cholamandalam Investment and Finance Co ($250mn) and NMDC ($233mn).
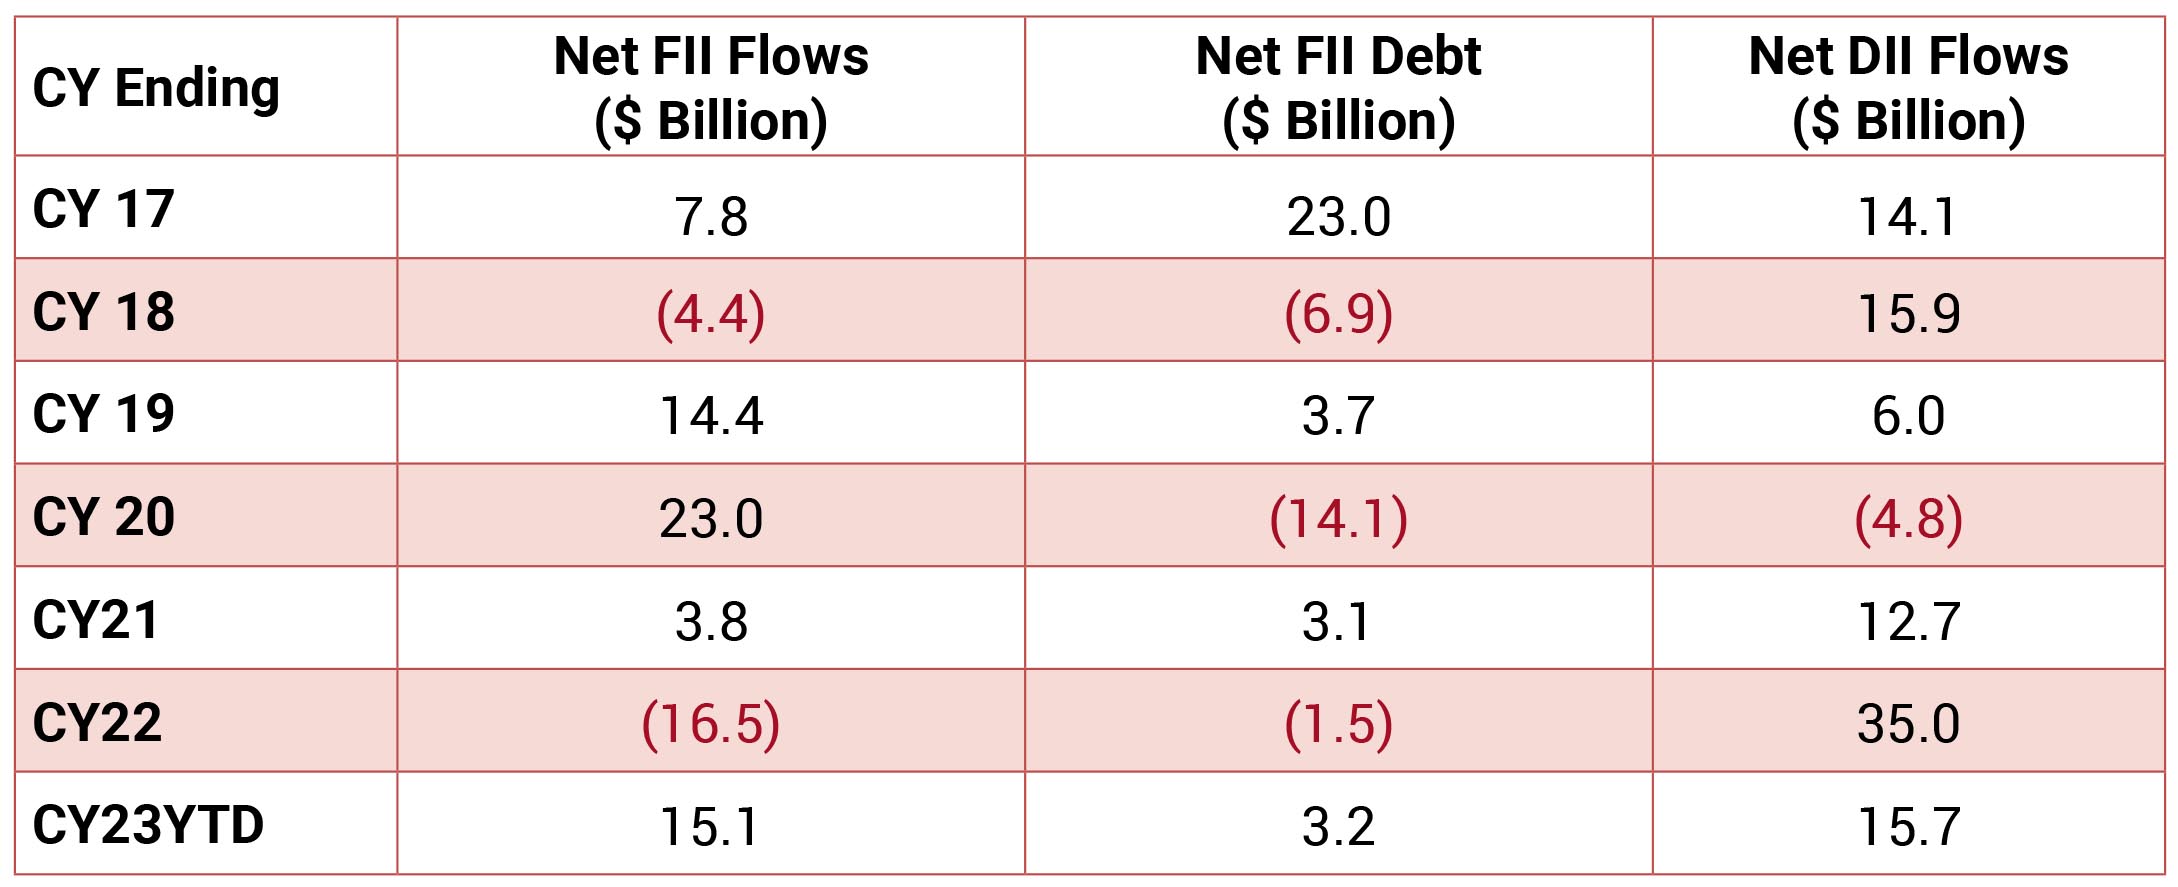
FIIs turned net sellers in the month of September 2023 to the tune of $2.52bn while DIIs remained net buyers to the tune of $2.45bn.
FIIs turned net sellers in the month of September 2023 to the tune of $2.52bn while DIIs remained net buyers to the tune of $2.45bn.

