In July, global equities posted a gain of 1.3% for the month. Among the major regions, MSCI China and USA were the best
performers, gaining 4.5% and 2.2%, while Brazil and India were the weakest returning -7.0% and -5.2% respectively. Nifty
50 was down 2.9%, closing the month at 24,768. The underperformance was driven by a sluggish start to the ongoing
earnings season, notable capital market activity, uncertainty around tariffs throughout the month before a ‘25% tariff plus
penalty’ announcement on 30th July, negative FII flows, INR depreciation and oil price spikes. Large-caps fell by 3.3%,
underperforming small and mid-caps, which fell by 2.0% and 2.6%, respectively. Most sectors ended the month in the red.
Indian benchmark 10-year government bond yields averaged 6.37%, slightly above June’s 6.34%, On month-end values, the 10Y yield was higher and ended the month at 6.42% (up 3 bps MoM). Meanwhile, U.S. 10-year yield closed at 4.35% (11 bps higher MoM). INR depreciated 2.1% over the month and ended the month at 87.5950/USD, with one year depreciation at 4.6% now. Oil prices rose 7.7% in July closing the month at $71.70, following a 6.3% rise in June.
Global markets did relatively well, amidst tariff developments. Trade deals were generally better-than-feared for most markets except for India, while a deal with China is still pending. On the other hand, the then-seemingly strong US job market, sticky inflation, and Fed Chair Powell’s resistance to Trump’s rate cut requests led US 10-year Treasury yields higher and the USD stronger. Gold prices remained flat and closed at $3293 in July.
The Indian economy struggled in comparison to global peers due to a mix of factors, including tariff uncertainty, negative Foreign Institutional Investor (FII) flows, and rising oil prices. Throughout July, there was concern over potential US tariffs on Indian exports, and on July 30th, President Trump threatened to impose a 25% tariff and a penalty on Indian exports starting August 7th. This penalty was linked to India’s oil imports and its purchase of military equipment from Russia. The proposed tariffs are close to the 26% retaliatory tariffs announced on “Liberation Day” and are higher than those imposed on most other Asian nations, except China. If enacted, India’s effective tariff rate could rise from 10.7% to 22%, factoring in exempted sectors and higher tariffs on copper, steel, and aluminum. In the second half of July, FII outflows surged, with $2.5 billion sold compared to just $0.3 billion in the first half. This intensified capital flight reflects a loss of investor confidence. Additionally, oil prices surged due to concerns over supply following President Trump’s shortened timeline for Russia’s war in Ukraine. These rising oil prices, combined with worries about India’s growth outlook, high valuations, and the lack of exposure to emerging areas like artificial intelligence and stablecoins, contributed to economic unease.


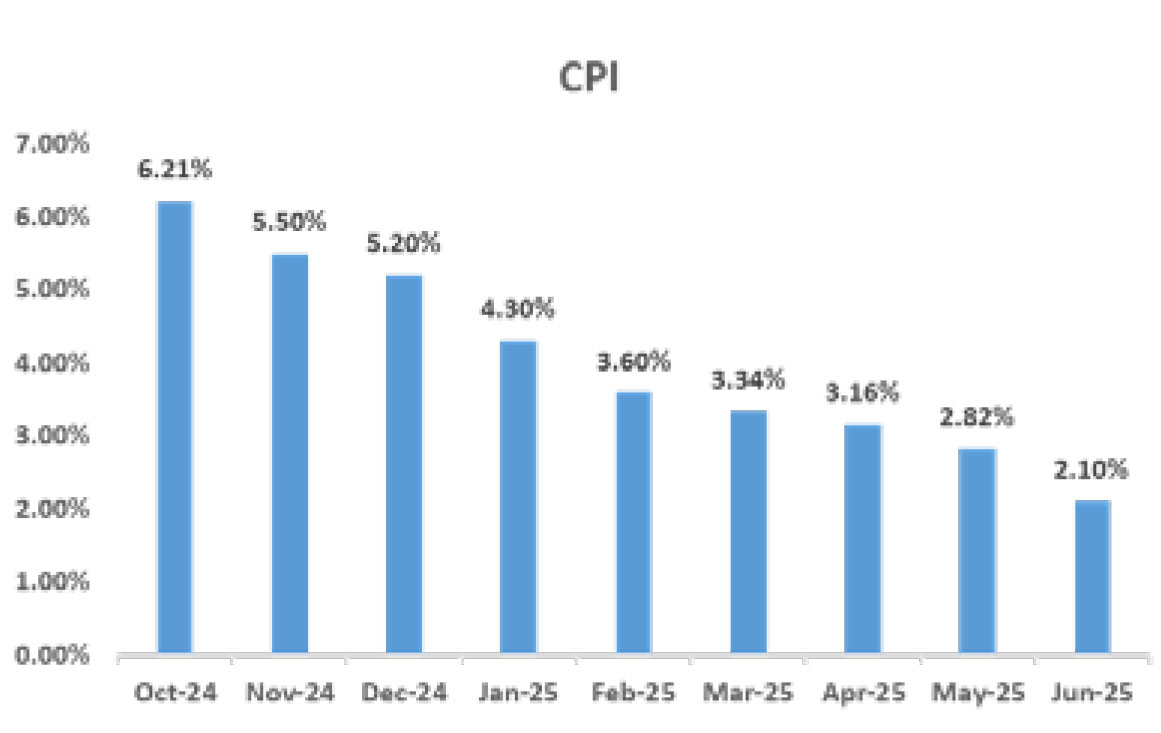
CPI: In June, the Consumer Price Index (CPI) came in as expected, registering a 77-month low of 2.1% year-on-year (YoY), down from
2.8% in May. On a month-on-month (MoM) basis, headline prices remained flat, while food prices decreased for the sixth consecutive
month, dropping by 0.6%. This reduction in food inflation is largely due to favorable factors such as strong monsoons, record harvests,
and the diminishing impact of El Niño. Meanwhile, the Wholesale Price Index (WPI) inflation came in well below expectations at -0.1% YoY,
a decrease from 0.4% in May. The decline in headline inflation in June was coupled with relatively low core inflation, which, excluding
gold, silver, and fuel, stayed below 4%. This points to softer underlying consumption, indicating that the economy may require additional
support from monetary policy to stimulate demand.
Trade: India’s goods trade deficit decreased to $18.8 billion in June, down from $21.9 billion in May, mainly due to a drop in non-oil, nongold (NONG) imports. However, this was partially offset by weaker exports, excluding oil. As a result, the core deficit narrowed from $9.6 billion to $7.5 billion, aligning with the average deficit over the previous six months. Exports have continued to show weak performance, though with some fluctuation, and June followed that trend. Non-oil exports declined by 4.3% month-on-month (MoM) in June, erasing most of the 4.6% gain in May. A similar downward trend was observed in manufacturing exports, which are typically less affected by price changes. Breaking it down by country, the front-loading of exports to the US in Q1 2025 has only slightly slowed down, raising the possibility of a future dip in exports. The US accounts for 20% of India’s total goods exports, which increases the risk of volatility in this key market.
BOP: India recorded a current account deficit (CAD) of $23.3 billion (0.6% of GDP) for FY 2025, an improvement from the $26 billion (0.7% of GDP) deficits in FY 2024. This narrowing was primarily due to higher net invisibles receipts, including services exports and remittances. The January-March 2025 quarter saw a current account surplus of $13.5 billion (1.3% of GDP), a significant turnaround from the $11.3 billion deficit (1.1% of GDP) in Q3 FY25. This surplus was driven by strong services exports and a decline in merchandise imports. Net FDI inflows were $1 billion in FY 2025, a decrease from $10.2 billion in FY 2024. Net FPI inflows stood at $3.6 billion, down from $44.1 billion in the previous fiscal year. India’s external debt increased by $67.5 billion to $736.3 billion by March 2025, with the external debt to GDP ratio rising to 19.1% from 18.5% in March 2024. India’s foreign exchange reserves increased by $8.8 billion on a balance of payments basis in the March quarter, lower than the $30.8 billion accretion in the year-ago period. Meanwhile, forex reserves in FY25 saw a net depletion of $5.0 billion during FY25, as compared to an accretion of $63.7 billion in FY24. Net inflows under external commercial borrowings (ECBs) to India amounted to $7.4 billion in Q4FY25, as compared to $2.6 billion in the corresponding period a year ago. Non-resident deposits (NRI deposits) recorded a net inflow of $2.8 billion in the March quarter, lower than $5.4 billion a year ago.
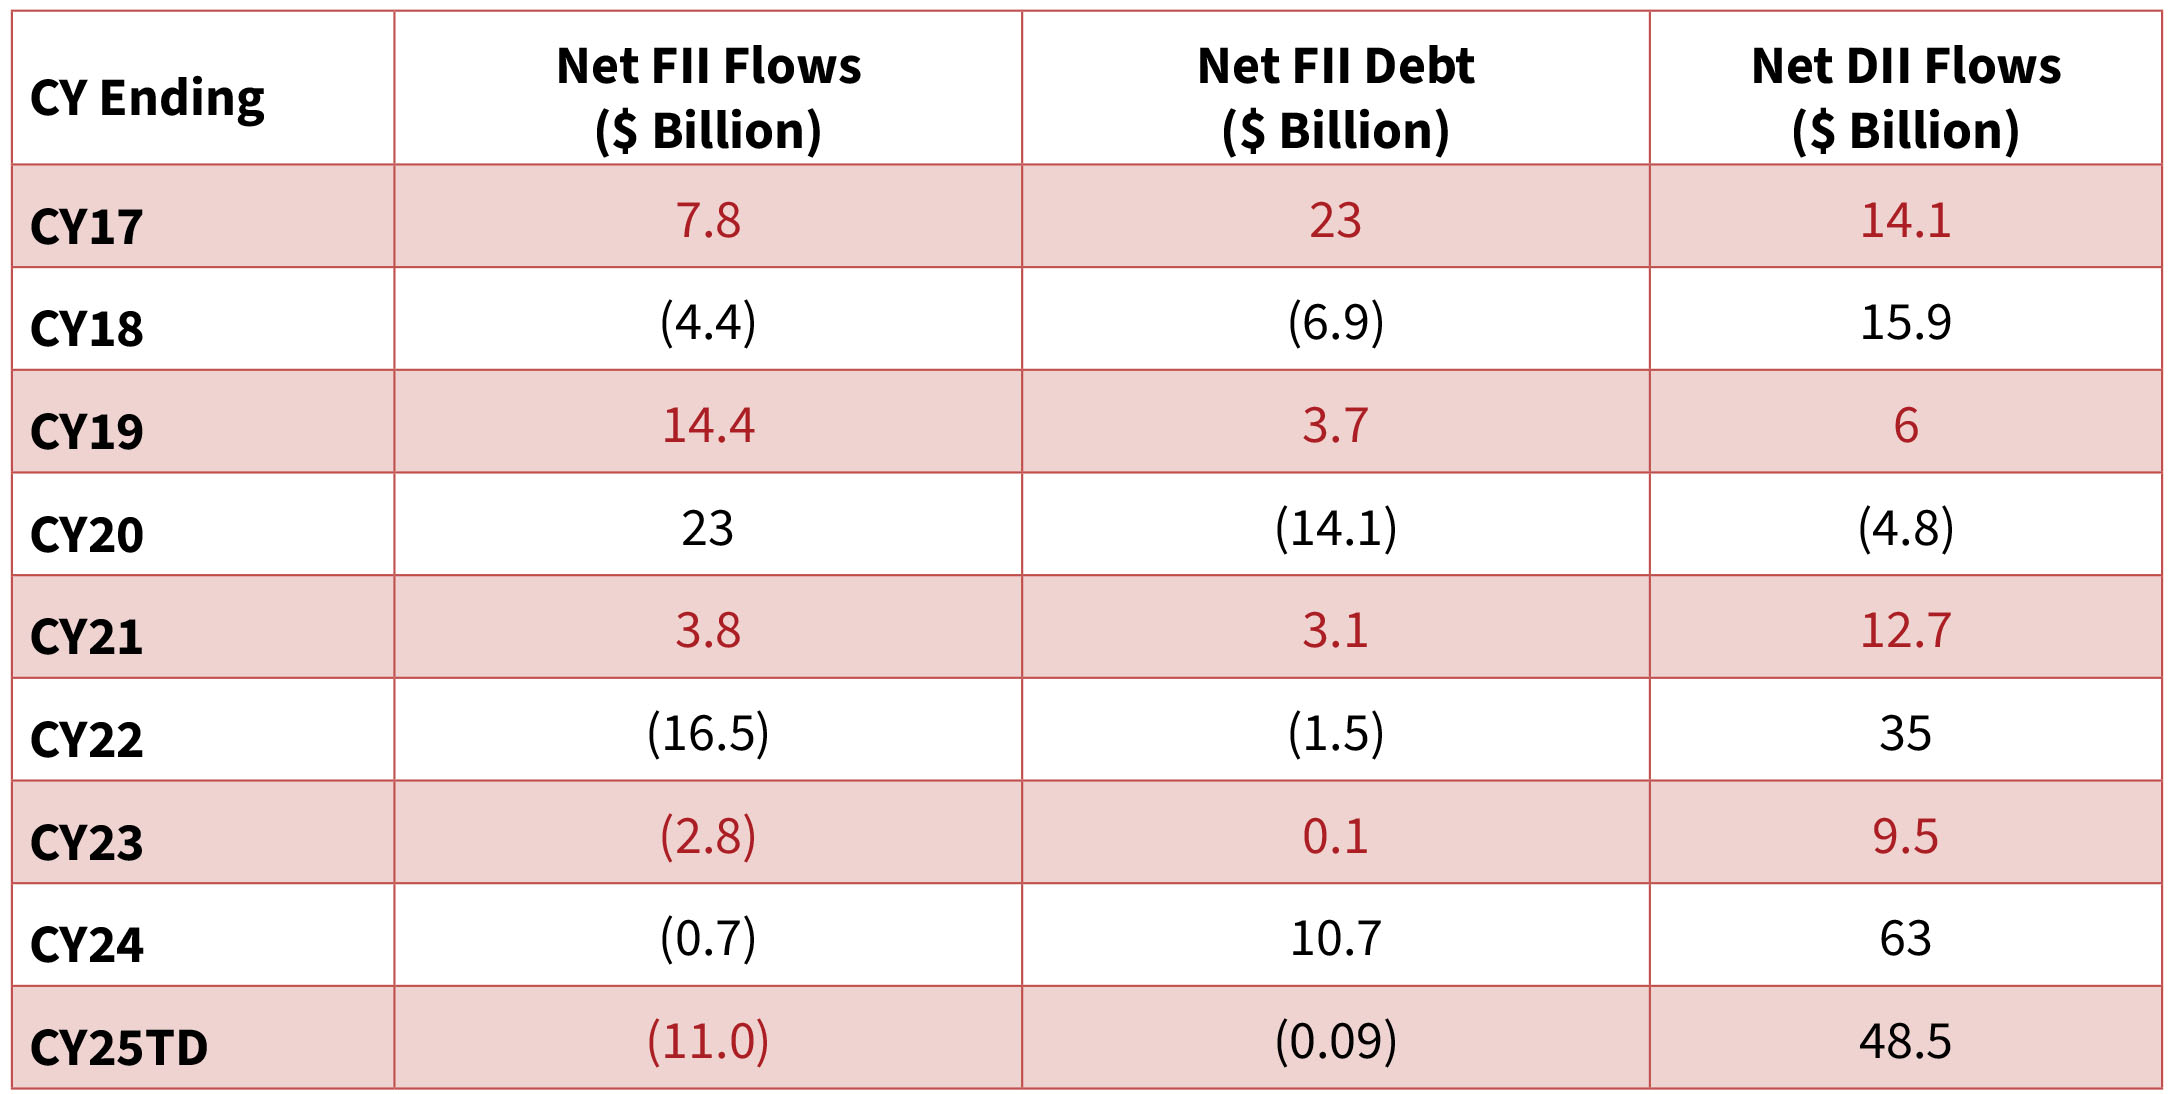
FIIs turned sellers, after buying for 4 consecutive months - with an outflow of $2.8bn in July (vs inflows of $2.4bn in June). FIIs were,
however, small buyers in the bond markets with an inflow of $0.1bn, following a $0.06bn buying seen in June. DIIs remained net buyers
for the 24th consecutive month, with inflows of $7.1bn in July (vs. inflows of $8.5bn in June). Mutual funds were net buyers in July, with
inflows of +$5.1n (similar to June flows). Insurance funds were also net buyers, with inflows of +$1.9bn (vs +$3.4bn in June). Retail turned
buyers with inflows of $1bn (vs. $0.4bn of outflows seen in June).


