In August, global equities posted a gain of 2.4% for the month. Among the major regions, MSCI Brazil/Japan were the best
performers (+9.2%/+6.9% respectively). Nifty 50 was down 1.4%, closing the month at 24,427. The underperformance was driven
by additional tariff implementation expected to hit growth, persistent FII selling, surge in fund raising and a weaker INR. Large caps
fell by 1.5%, outperforming small/mid-caps, which fell by 2.8% each. Most of the sectors ended the month in the red, except for
Discretionary and Staples. Financials, Real Estate and Utilities were the worst performers. INR depreciated by 0.7% and ended the
month at a record low of 88.21/USD. DXY depreciated by 2.2% in August (following an appreciation of 3.2% in July), ending at 97.8.
Indian benchmark 10-year government bond yields averaged 6.47%, slightly above July’s 6.32%, On month-end values, the 10Y yield was higher and ended the month at 6.57% (up 19 bps MoM). Meanwhile, U.S. 10-year yield closed at 4.23% (11 bps lower MoM). INR depreciated 0.7% over the month and ended the month at 88.1950/USD, with one year depreciation at 5.1% now. Oil prices fell 6% in August closing the month at $67.38, following a 8% rise in July.
Globally, the release of US non-farm payrolls for July suggested the US labour market was slowing. At Jackson Hole – the Federal Reserve’s annual get-together for central bankers – Fed chair Jerome Powell suggested the balance of economic risks had shifted based on this release, potentially warranting an adjustment to the Fed’s policy stance. As a result, rates market now price in a high likelihood that the Fed will reduce the fed funds rate by 25 basis points at its September meeting. July’s non-farm payrolls report was weaker than expected. There were fewer trade announcements than in recent months. Nonetheless, the US imposed higher ‘reciprocal’ tariff rates on a range of its trading partners at the start of August, and later placed a 50% tariff on India in an attempt to discourage its purchasing of Russian oil. Oil and natural gas prices fell, and the gold price continued to rise. In Europe, French government bonds underperformed as political turbulence led investors to question whether France could achieve fiscal consolidation. Eurozone inflation came in in line with expectations in July. Second-quarter GDP prints were better than expected in France and Spain. UK Gilts came under further pressure following another upside surprise to UK inflation in July. In response, investors scaled back their expectations for rate cuts by the BoE, raising short-end Gilt yields. Longer-dated Gilts also underperformed, with the UK 30-year government bond yield reaching 5.6% (its highest level since 1998) driven by thin liquidity and ongoing concern about UK fiscal sustainability. In Japan, headline inflation fell in July but was nonetheless hotter than expected at 3.1% year-on-year.
India 2Q GDP print exceeded market expectations coming in at 7.8% y/y. The outperformance was attributed to convergence of nominal GDP and real GDP growth, sharp outperformance in services growth and frontloading of government spending. S&P Global Ratings upgraded India’s sovereign credit rating to ‘BBB’ from ‘BBB-’, which was the lowest investment grade rating. This follows S&P’s revision of India’s outlook to positive in May 2024. The S&P upgrade comes after 18 years. The upgrade is premised on three factors which “coalesced to benefit credit metrics.” The S&P statement enumerated the three factors behind the upgrade: (i) Fiscal management: As S&P noted, the Indian government has prioritized fiscal consolidation, with the general government deficit budgeted to reduce to 7.3% of GDP by FY26 – lower than pre-pandemic levels -- from a pandemic peak of 13.4%. The quality of government spending has also improved, with a higher allocation for capital expenditure. (ii) Economic growth: The statement noted that the Indian economy “staged a remarkable comeback from the pandemic”. S&P expects GDP to grow by 6.8% annually over the next three years. The ratings agency expects public investment and consumer momentum to underpin growth in coming years. (iii) Monetary policy: As the statement noted, the switch to inflation targeting has anchored inflationary expectations. Despite global energy price volatility and supplyside shocks, CPI growth averaged 5.5% over the past three years. Recently, inflation has stayed at the lower bound of the Reserve Bank of India’s target range of 2-6%. Importantly, S&P believes that the 50% tariff (if imposed) by the US on India would not significantly impact India’s growth prospects given Indian goods exports to the US are ~2% of GDP. After threatening a substantial increase in tariffs on India on August 4, President Trump followed through by doubling tariffs from 25% to 50% through an Executive Order on August 6. The EO indicated that the incremental 25% was ostensible because of India’s imports of crude from Russia, and therefore can be thought of as secondary sanctions.


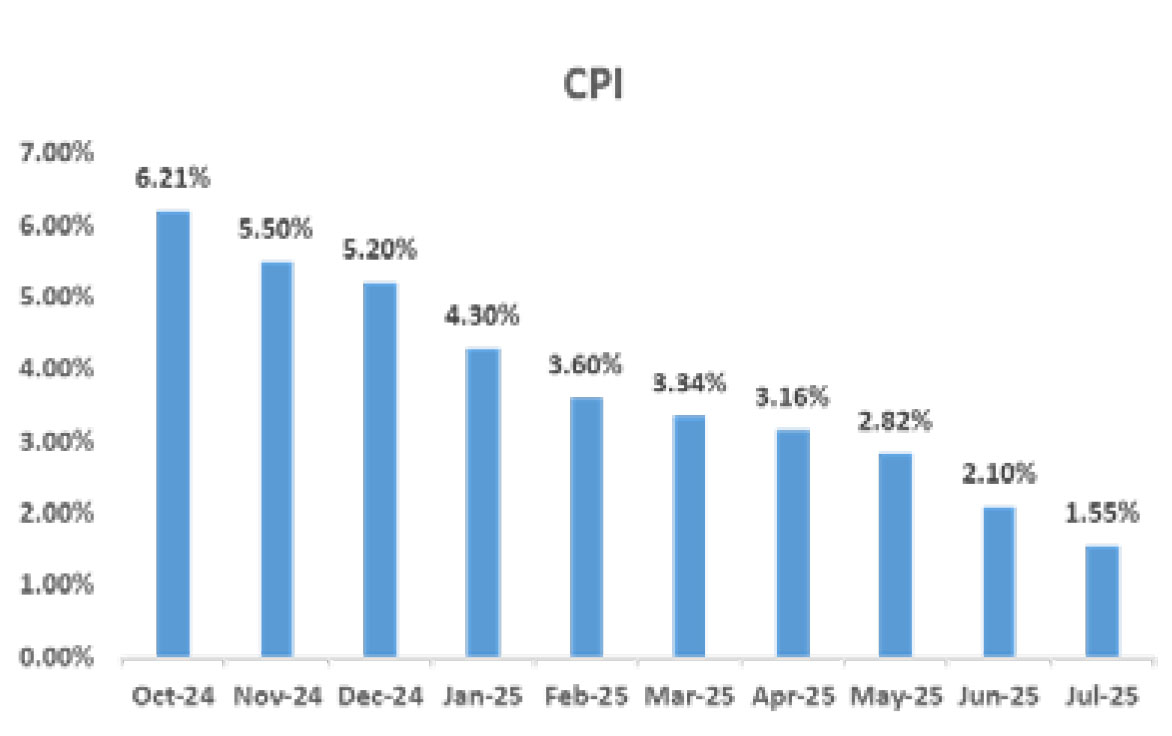
CPI: India July CPI gapped down to below 2%, as expected, coming in at a 97-month low of 1.6% y/y from 2.1% in June. That
said, the outturn was a touch firmer than market expectations. The July print was helped by large favorable base effects,
reinforced by soft headline momentum, with CPI prices rising 0.1% m/m. Importantly, core-core CPI prices also rose just
0.1% m/m in July and, ex-gold, rose just 0.05% m/m. Meanwhile, food prices, which had been contracting for six months,
rose 0.3% m/m in July. This increase was led by a seasonal rise in vegetable prices. Food prices ex-vegetables also rose 0.3%
m/m in July. Cereals and pulses exhibited softness. While the peak of the food price disinflation is likely behind us, food
prices are expected to remain contained due to expectations of healthy production this year. On a year-on-year basis, food
inflation was -0.8% in July, falling from -0.2% in June. While overall retail inflation has cooled, core inflation—that excludes
food and fuel—remains stubborn, even after a slight dip. It may be noted that core inflation better reflects what households
actually experience.
Trade: India’s merchandise trade deficit hit an eight-month high of over $27 billion in July as imports surged faster than exports ahead of U.S. President Donald Trump’s announcements of new tariffs on trading partners, including India. July exports showed no major fallout from Washington’s decision to sharply raise tariffs on a range of Indian goods, as the higher levies take effect only from August. In April-July, shipments to the U.S. rose 21.6% to $33.53 billion from $27.57 billion a year earlier, while imports from the U.S. climbed to $17.41 billion from $15.50 billion a year ago. India’s merchandise and services exports rose in July, led by engineering goods, electronics and gems and jewellery. Goods exports rose to $37.24 billion in July from $35.14 billion in June, while imports jumped to $64.59 billion from $53.92 billion, partly on pre-festival demand. Crude oil imports rose to $15.5 billion in July from $13.7 billion in June, while gold imports rose to $3.9 billion from $1.8 billion in the previous month. The trade deficit stood at $27.35 billion in July, higher than economists’ expectations of $20.35 billion, and against $18.78 billion in the previous month. The trade deficit hit a record $37.8 billion in November 2024.
BOP: India 1Q current account deficit (CAD) came in at USD 2.4 bn, or 0.2% of GDP – with a wide merchandise deficit offset by a near-doubling of the surplus in business services. The CAD is the lowest for the June quarter since 1QFY17. QoQ the current account deteriorated due to seasonality: the merchandize deficit rises, and tourist arrivals and remittances drop: Mar-25 had seen a surplus. Net capital and financial account (ex FX reserves) at USD 7.7 bn saw its first surplus since 2QFY25, driven by a recovery in net FDI in Apr, better equity FPI flows, higher NRI deposits and trade finance. This offset the impact of heavy maturity of RBI forward sales from last year. Adjusting for the maturity of RBI forwards and the volatile FPI flows, the true inflow was closer to USD 30 bn for 1Q. These were used to manage maturity of forwards of USD 24bn; the USD 4.5bn rise in FX reserves was mostly RBI’s interest receipts of 4.1 bn. In 2Q so far core BOP trends have worsened again, with the merchandise trade deficit rising, and large outflows of FPI equity (USD 8bn of outflows thus far).
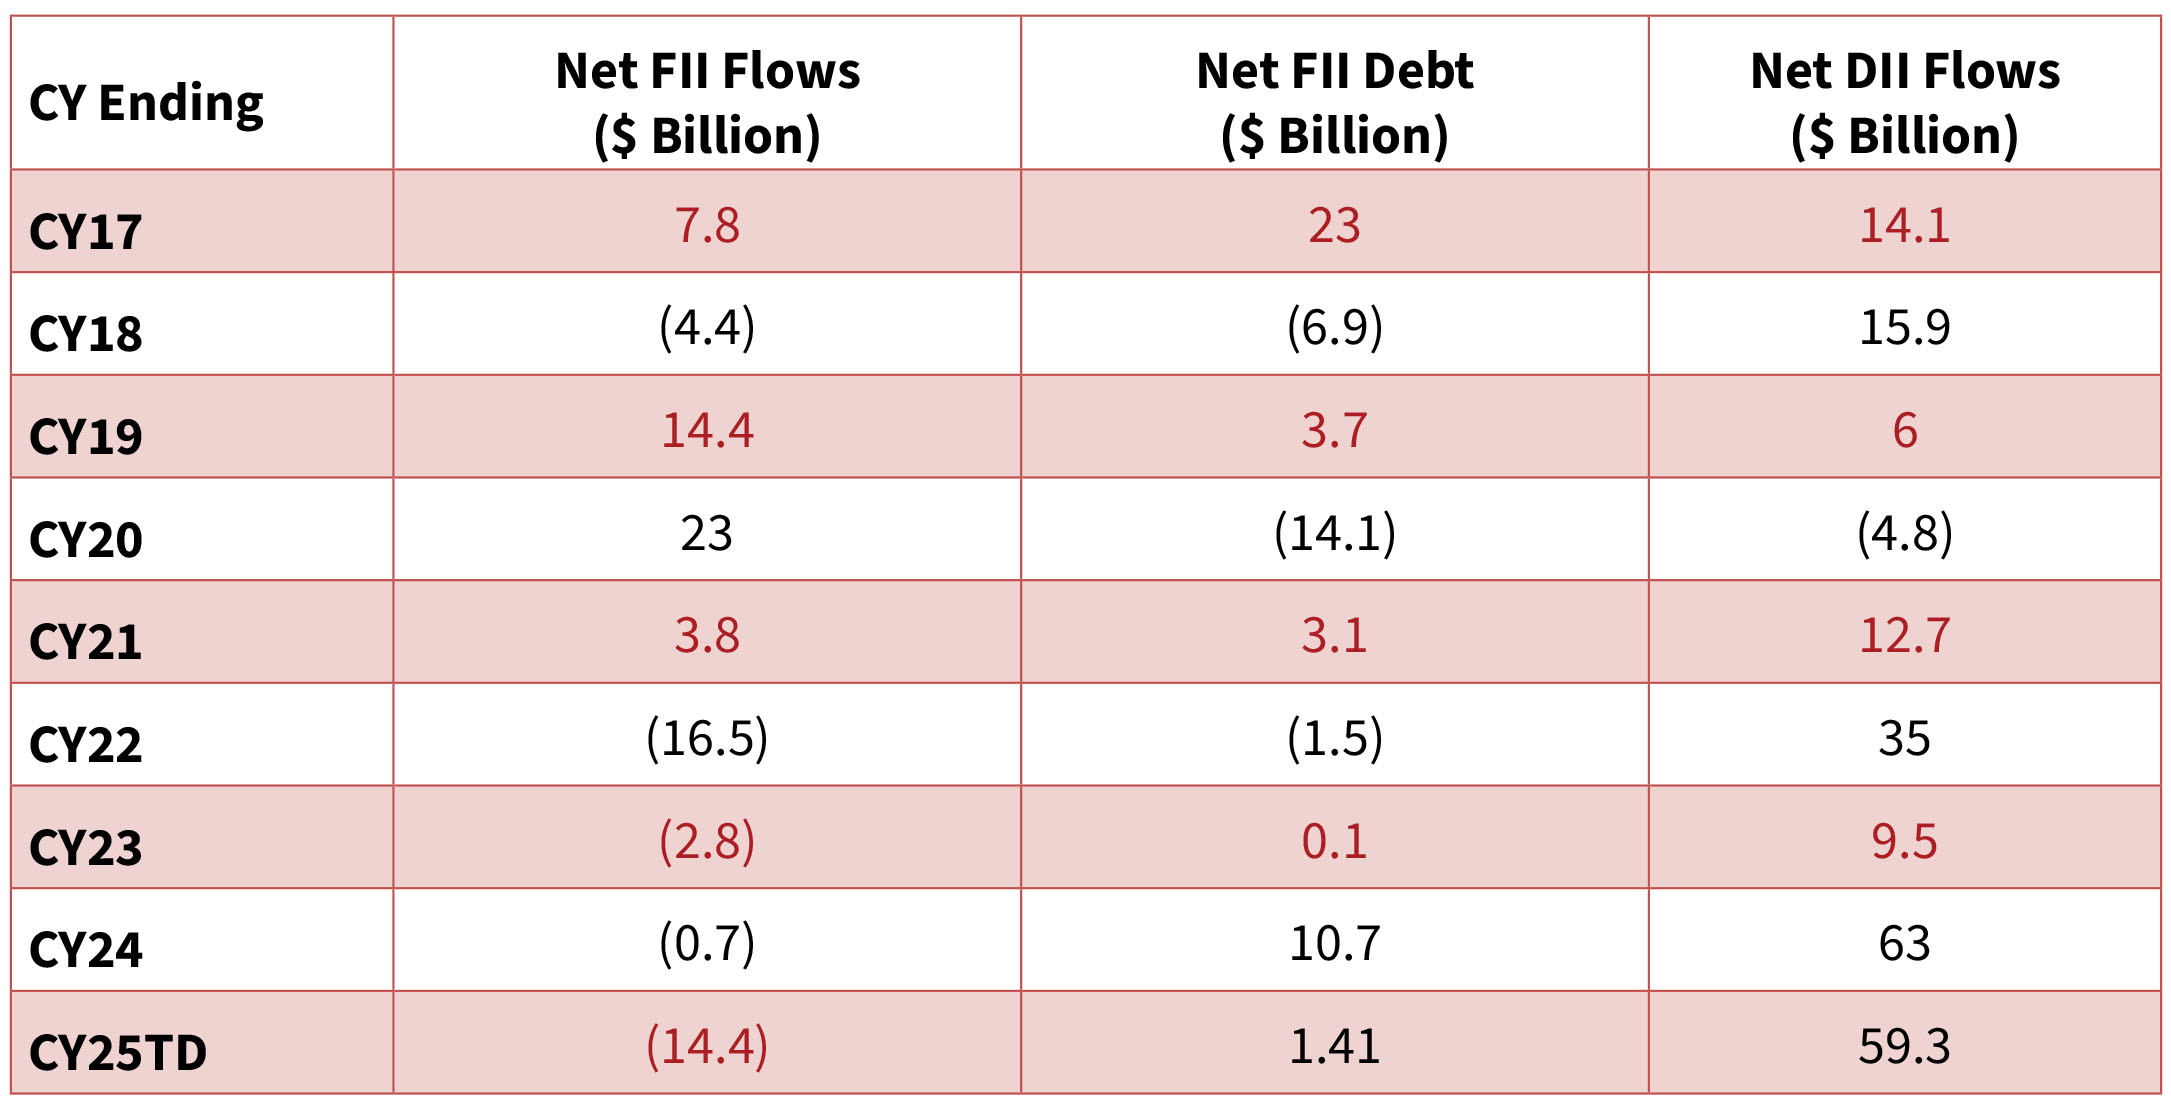
FIIs remained cautious - with an outflow of $3.3bn in August (vs outflows of $2.9bn in July). FIIs, however, continue to buy in the bond
markets with an inflow of $1.5bn, following a $0.1bn buying seen in July. DIIs remained net buyers for the 25th consecutive month, with
strong inflows of $10.8bn in August (vs. inflows of $7.1bn in July). Mutual funds were net buyers in July, with inflows of +$6.3n (vs $5.5bn
in July). Insurance funds were also net buyers, with inflows of +$4.5bn (vs+$1.6bn in July). Retail turned sellers with outflows of $0.1bn
(vs. $1.1bn of inflows seen in July).


